Author: way0utwest

  • When Will Privacy Matter?

    More and more people are becoming concerned about data privacy. There’s more advocacy, and this shows in more laws being passed around the world. Those are good steps forward, but those rules and restrictions are just the lowest bar of what I’d hope for. Regulation will always lag behind best practices and technology, and I’d hope that organizations look to do better.

    I expect more competition to crop up again in the future as the world grows, and I wonder if some of these businesses will start to take privacy seriously. Not because of regulation, but because it might provide some competitive advantage. I ran across a short piece that has a few ideas on how you might be more competitive in your niche if you take privacy seriously. These are ways that taking privacy seriously might make you more competitive.

    I think the big one for me is transparency. Showing customers that you are open and up front with data will pay off. Most of us know that our data is being collected. We know it’s being used for marketing. Many of us don’t love the idea, but we also do get used to the value we do get from services. A few people might balk, but once they realize everyone is collecting and using data, they’ll appreciate those that are more transparent.

    Certifications are nice, and having employees work on security can help, but for privacy, we need to help customers understand how and why we use data. We need to respect their data, and learn to remove it when a business relationship goes away. It can be tough for many data pros and business people to get rid of data, but it’s prudent, it reduces the strain on live systems, and it helps build trust with customers. Plus, if you are treating customers well and they appreciate it, they’ll come back over and over, which usually means you won’t ever need to trim much of their data.

    Steve Jones

    Listen to the podcast at Libsyn, Stitcher or iTunes.

  • Daily Coping 31 Mar 2010

    I’ve started to add a daily coping tip to the SQLServerCentral newsletter, which is helping me deal with the issues in the world. I’m adding my responses for each day here.

    Today was interesting: Take give minutes to sit and breathe. Repeat often.

    It’s funny, I regularly practice yoga, and this is something we do in class. I’ve used my watch to track my exercise, and I can see when my heart rates rises, so I know we often sit for about 5 minutes quietly, or with a quote/thought from the teacher, before we get moving.

    I tried this a couple times last week. I set a timer on my phone for 5 minutes, stood up, closed my eyes, and tried to just be. No music, nothing to see, just see if my mind can quiet. Sometimes it didn’t and thoughts continue to swirl through my head, sometimes I relaxed, as I might do when walking or driving and my thoughts quietly flow.

    It’s surprisingly hard to just stop for 5 minutes, and I don’t know if I can do it more than once a day. So far, I haven’t, but I will be thinking about adding this to part of my routine.

  • Charting in Azure Data Studio

    The March 2020 release of Azure Data Studio (ADS) includes a charting feature for SQL queries. This is a quick look at the feature, which I think will have some value for users.

    SQL Queries

    This has been available with SQL queries, but now it’s in notebooks as well.  If I run a basic query in ADS, I see something like this:

    2020-03-23 12_52_07-Window

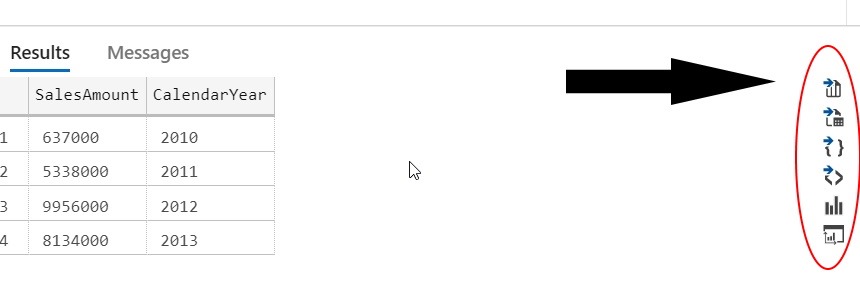
    I have a query and some results. These are numerical results that are easily graphed. However, in the results area, to the right, there are a few icons. I’ve added and arrow and oval in the image below to help you see them.

    2020-03-23 12_54_14-Window

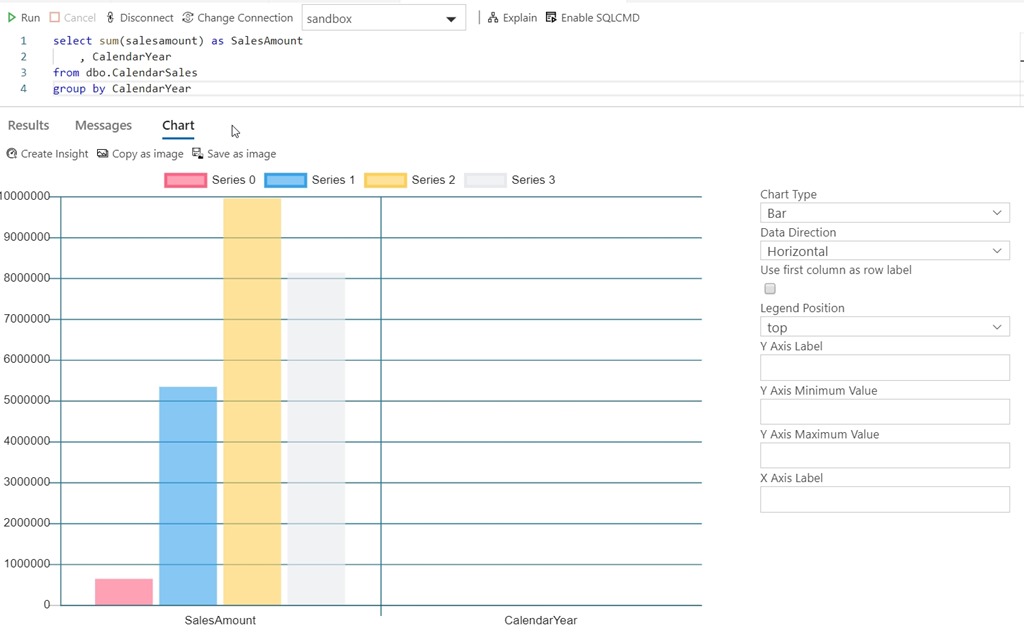
    We have lots of options here for exporting results or visuals., The 5th one down is a chart icon. If I click that, I see this:

    2020-03-23 12_57_04-Window

    By default, a bar chart, but as you see on the right, there are lots of options. I’ll write more as I play with them a bit and get another ADS article at SQLServerCentral.

    Notebooks

    The charting experience comes to notebooks in a similar way. I can create a notebook and add a SQL cell. In there I have code and run it.

    2020-03-23 13_02_03-Window

    You can see the same icons here above the results. If I click the far right one (the chart), it changes to a chart.

    2020-03-23 13_02_40-Window

    If I save the notebook like this and reopen it, the chart is gone. The results are still there, as these are saved with the notebook, but the visual display is gone. I think this is fine, because the chart icon is there, but I wish the state was saved as I’d saved it.

    One note, once the chart appears, notice the right icon is now a table icon. Clicking it returns to the original view.

    This is a quick look at charting in ADS. I’ll do something more extensive at SSC soon.

  • T-SQL Tuesday Live–31 Mar 2020

    I’m hosting another live T-SQL Tuesday event tomorrow, which is really just a casual video meeting for anyone that wants to join and take a break from work, life, or anything else.

    In this time of difficulty, I think this is a great coping mechanism that might help you keep in touch with the community. I know it’s certainly good for my mental health.

    This week the theme is: Securely connecting

    Most of us are remote now, and we’re often at home. This can prevent some challenges. Networking aside, security is still a concern. What you are doing? Jump boxes, rdp to servers or your desktop at work or something else?

    We’ll start with this theme, but we’ll see where the conversation goes. We’ll also do a health check with people, talk about anything good that’s happened?

    I’ll use Zoom with this meeting URL: Removed (see the most recent post for the URL)

    The date: Tuesday, March 24, 2020, and time:

    • 13:00MDT
    • 15:00EDT
    • 19:00UTC

    Just an hour. Jump on, say hi, give us your thoughts, problems, or just listen.