Tag: data analysis

  • Democratic Data Science

    I know quite a few people that are jumping on the data science bandwagon, brushing up on statistics, learning R, and hoping to land one of those lucrative data scientist positions. I wish you good luck, and some of you will succeed, but I wouldn’t count on there being lots and lots of data science positions in the future. The work is hard, and it will take a lot of learning and practice to become good. Plus, perhaps we won’t need as many data scientists as some are predicting.

    There seems to be a lot of work being done with intelligent agents and “bots” that can perform some lower level analysis of data and interact with humans. However, there is also work being done with more capable software that might analyze data and find patterns by applying different algorithms and analysis to make it easier for business analysts to comb through the mountains of data. After all, the growth of IoT, of more metrics and measurements being made in all kinds of applications mean that we can’t just throw bodies at problems. We need better ways to work with large amounts of data.

    This work isn’t really aimed at eliminating data scientists or data analysts. Rather, this is aimed at trying to free up their time to do the creative, thoughtful work of examining data. The grunt work of playing with algorithms and testing them according to some measure of success is handled by software. I think that this is a mantra that will be repeated over and over in the next couple decades in computing. Grunt work is automated, thoughtful work is done by (well-paid) humans. If you’re not doing the latter, you might not have a job with the former.

    I do think there is still plenty of opportunity for data professionals, after all, we need to manage all that data, find ways to ensure it’s available and can be queried, data is somewhat clean, and certainly that we have some idea of what the data means to our business. I’m not sure software agents will easily be able to set those things up, though certainly they’ll do the work of applying our rules to large sets of data.

    There will still be plenty of data science roles, and certainly humans need to be watching the software to be sure it’s working well. There will always be tuning efforts, and perhaps always reports that users need help in building. However, as software becomes more sophisticated, there will certainly be less grunt work in our industry, just like many other industries have seen lower, or at least lower mid-level positions reduced in number. We should be prepared to prove our value and ensure our skills are useful to our organizations.

    Steve Jones

    The Voice of the DBA Podcast

    Listen to the MP3 Audio ( 3.0MB) podcast or subscribe to the feed at iTunes and LibSyn.

  • We Manage Algorithms

    “Every business is an algorithmic business.”

    That was a phrase that Microsoft’s Joseph Sirosh used in a keynote at SQL Nexus, talking about the future of software and data. Rather than managing data, many of us will move to manage algorithms, which will determine how data is interpreted, used, processed, and potentially returned to users as information. There are starting to be too many sources of data, too much data itself, being generated at too quick a rate, to the point where algorithms become more important than the actual data in examining, grading, interpreting, filtering, and more.

    This is exciting on one hand, with new opportunities for those that can develop, choose, write, tune, or enhance algorithms. I can easily see greater influence from both developers and DBAs as we work to better manage the floods of data. Especially with 50 billion sensors, IoT devices, and more that are predicted to be online in the 5 years. That’s potentially a tremendous amount of data being generated.

    On the other hand, this is a bit scary as separating good data from bad in the ocean of bits, and choosing helpful rather than hurtful algorithms might create lots of stress, and perhaps even fewer opportunities if few algortihms are reused. This also means we will need algorithms that can help us determine if data is actually good enough to use. After all, in the deluge, there will be bad data, that potentially needs to be excluded from queries. Will software developers become more important than DBAs as we end up with more unstructured data stores, data lakes, or other constructs that might require less administration?

    I’m not sure how things will change, but it will be an interesting world the next few years as we work with larger and larger, more diverse sets of data in our organizations.

    Steve Jones

    The Voice of the DBA Podcast

    Listen to the MP3 Audio ( 2.3MB) podcast or subscribe to the feed at iTunes and LibSyn.

  • Grabbing Fitbit Data

    Recently the T-SQL Tuesday topic was Power BI. A cool topic, and an interesting application.

    I saw Rob Farley build a dashboard based on his Fitbit data. That was intriguing, so I went to get my data. I’ve worn a Fitbit for a couple years, recently having lost it. However, when I went to export my data from Fitbit, I found this.

    2016-02-17 10_46_02-Fitbit Data Raw Export

    Notice two things. One is the top announcement that my data belongs to me. Then notice the bottom left note that I can get 31 days of data.

    Jerks, but feel free to substitute another word yourself.

    Then I found this Fitbit Data Export site. I connected and ran this, which grabbed my data. I appreciate there’s a Github link with the source code, though I have no idea of what’s in Github corresponds to what’s running in Azure. After reading The God’s Eye View, it’s a little nerve wracking to use a service to connect somewhere that I have data stored, but Fitbit exposes some of this publically anyways, and besides, it’s not critical data for me.

    In any case, I had a CSV of my data, which I am now going to upload into Power BI and play with it. Adding a CSV is straightforward.

  • T-SQL Tuesday #75–Power BI

    This month’s host is Jorge Seggara, the @sqlchicken, who works for Microsoft. A busy schedule caused a slight delay, so we’re posting the third Tuesday of this month, but that is OK. This is a great topic for T-SQL Tuesday.

    Power BI Data

    While Power BI is a great visualization tool, you can’t do anything without data. That means you need to find data, which is both easy and hard. Easy if you’re working within your own organization on a specific project. Slightly more complex if you want to look at data out in the world.

    However I saw this in a talk last year and I was amazed. This is the type of thing I’ve written before, and it’s cumbersome and problematic. I would think that SSIS would have made things this simple years ago.

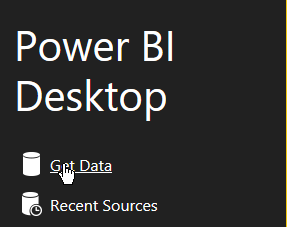
    I love sports, and wanted to play with some sports statistics awhile back. Finding good data is tough, at least in a format like CSV, that you can easily import. However Power BI makes this easy. Start up the desktop and you’ll see this:

    2016-02-10 14_07_40-Calendar

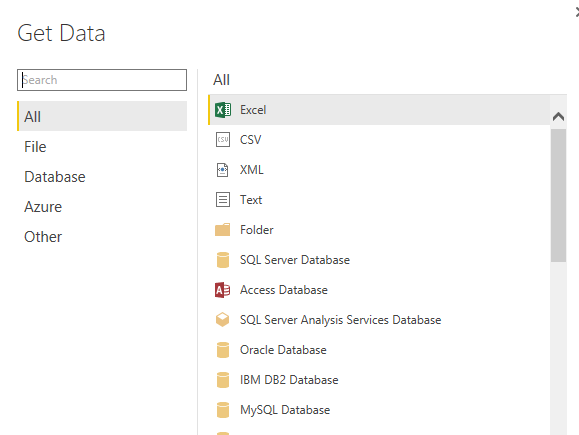
    Right away Power BI wants to get data. Click on this and the Get Data dialog opens, with lots of choices.

    2016-02-10 14_07_57-

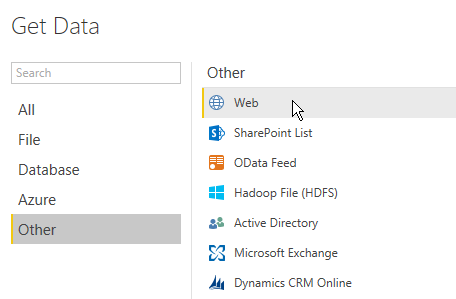
    However if you pick “Other”, you’ll see one more that I love. Web.

    2016-02-10 14_13_55-Calendar

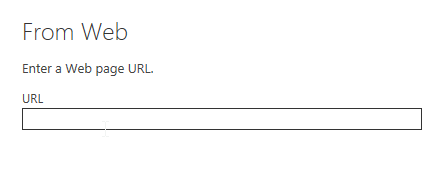
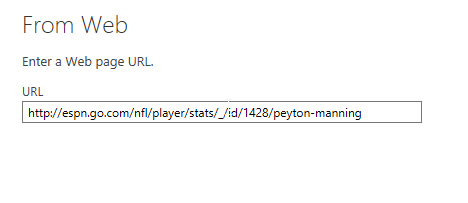
    Click this. You get asked for a URL. Any URL.

    2016-02-10 14_14_35-Calendar

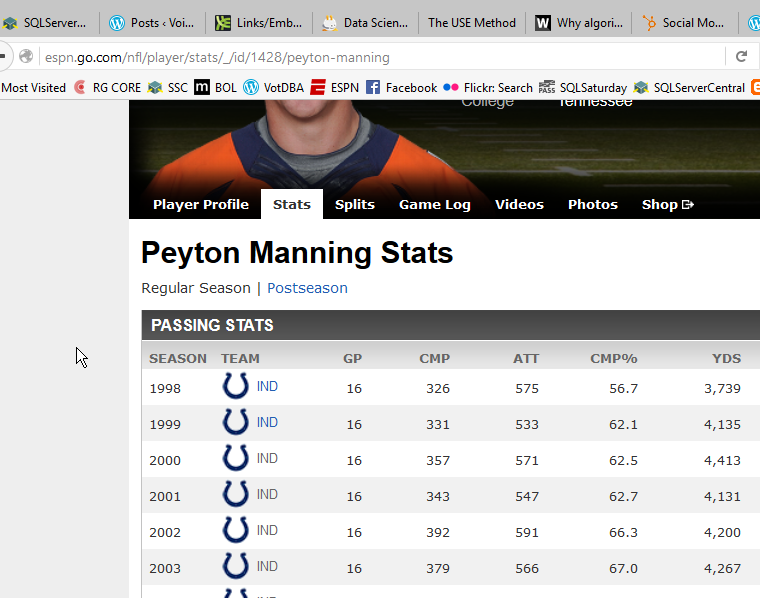
    I happen to have one handy. After the win for Denver in Super Bowl 50, I thought I’d look back at Mr. Manning’s career.

    2016-02-10 14_14_44-Calendar

    I take that URL and drop it in the dialog.

    2016-02-10 14_14_52-Calendar

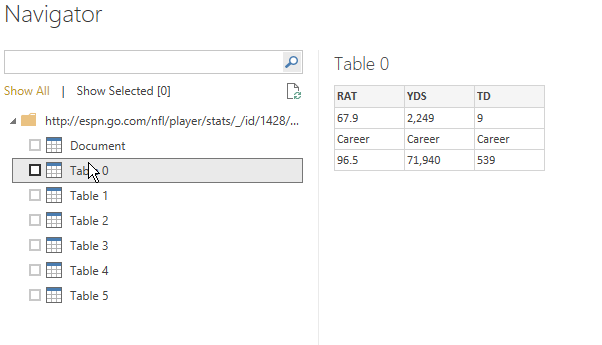
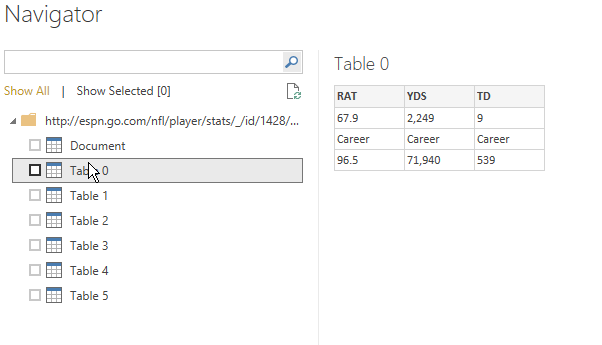
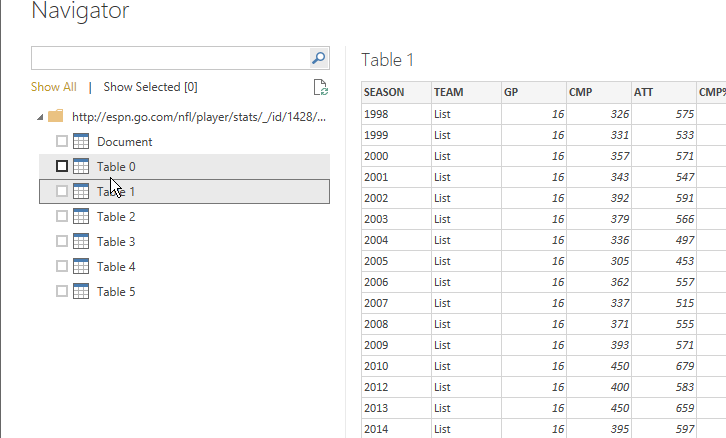
    Once I click OK, this will analyze the URL for tables of data. In this case, I get quite a few.

    2016-02-10 14_16_32-Calendar

    Now, I can click each one to see what data this is. This isn’t what I want

    2016-02-10 14_16_32-Calendar

    But this is.

    2016-02-10 14_16_37-

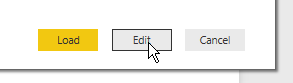
    I now click “Edit” at the bottom to clean my data. I could just load it, but there are a few issues.

    2016-02-10 14_16_47-Untitled - Power BI Desktop

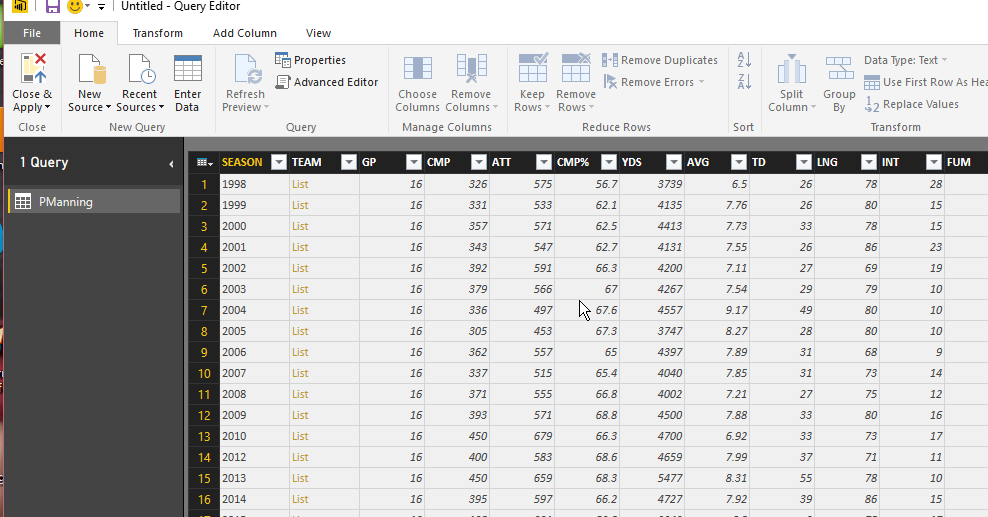
    I see all the data in the designer, and I have lots of options for working with this data.

    2016-02-10 14_17_11-Calendar

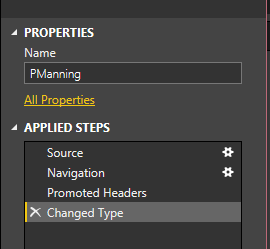
    First, since I’m going to do a comparison, let me rename the table.

    2016-02-10 14_17_02-Untitled - Power BI Desktop

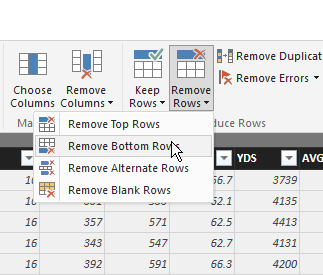
    Next, I see the steps below the name. I’ll add more steps, but I’ll do this in the designer GUI. First, let me remove the last row, which is a career summary.

    2016-02-10 14_19_28-Calendar

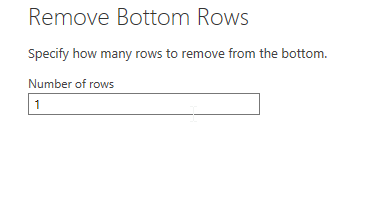
    In this case, I’m only removing one row.

    2016-02-10 14_19_36-Calendar

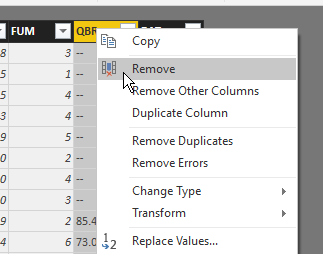
    Now, I want to remove a couple columns. In my case, I don’t care about a few of the data items, so I’ll pull them away. I can right click a column or choose “Remove Colums” in the ribbon. Either way, I get rid of QBR and Team.

    2016-02-10 14_20_50-Untitled - Query Editor

    Now I’ve got a nice year by year summary of Peyton Manning’s career. When I close and apply the query, my data is loaded into a data set for use by my Dashboard. I can then repeat this, and I’ll have two sets of data.

    And, here’s my PowerBI Dashboard. It’s not terribly useful, or interactive, but it’s got data from the web that I didn’t have to copy or move.

    https://app.powerbi.com/view?r=eyJrIjoiMWNmYzBiYjUtMTU3Yi00NWFhLWFiZjQtNTY0NzY4NDRkZTJmIiwidCI6IjY2NjBkOGZkLTJjNmItNDg0Mi1iZmZmLTcxOTY1YzE2NTczYSIsImMiOjN9