Tag: data analysis

  • How Important Are Real Time Decisions?

    Imagine a perfect world? I have an AI agent that knows my business well. It’s getting real time input from sales, from customers, it makes amazing decisions. We get a large order? We need to ramp up production of our widgets. We have an order pipeline of xx widgets and we know over time that yy% will close. Let’s place a larger order with a supplier overseas.

    The next day, we have an election and tariffs are announced on imported parts. We react immediately, cancel the order, start the process to expand a local factory. We place ads to hire workers and order equipment. Things are looking good for our business and our factory will be up and running in a few months.

    The next week we find out the tariffs weren’t really being enforced, so they’re paused. Our AI agent re-places our large order for imported parts and tried to cancel the factory expansion. Of course, it calculates the costs of both sides before deciding, and perhaps consults with me on other uses of our local factory.

    How many times can we do this? Or rather, how many times would we let an AI agent keep adjusting our business?

    To be fair, humans might do the same thing and over-react, but mostly we become hesitant with unexpected news. That slowness can be an asset. We often need time to think and come to a decision. Lots of our decisions aren’t always based on hard facts, and a lot of business isn’t necessarily fact driven either. We often put our thumb on the scales when making decisions because there isn’t a clear path based on just data.

    Things can get worse when we collaborate. I used to run real-time reports for an importing company, and we found that executives would print a report, get busy, and after minutes (or hours), discuss the report with someone in a department. However, their numbers rarely matched because the reports were printed at different times. At first they lost trust in the system because the same report on the same day had different numbers. Even when we added a “print” or an “as of” time, the reports were too annoying to users to be helpful because the numbers didn’t match.

    Real time isn’t what most of us want. Except in the Olympics. There we want the photo finish right away.

    But not in all sports. A review is good. In the NFL, I’ve come to like instant reply. It’s gotten better/faster and often gives us the right answer. Not always, but often. It’s better, arguably, then just real-time humans.

    Real-time decisions and reactions can be good in some cases. Adjusting machinery, vehicles, electricity, etc. where we need too-quick-for-humans decisions based on data is a good place for real time data. Lots of business decisions we make aren’t the places where we really need real-time insights. Our human brains just don’t work that fast.

    Steve Jones

    Listen to the podcast at Libsyn, Spotify, or iTunes.

    Note, podcasts are only available for a limited time online.

  • Data Analysis Techniques

    This is part of a series on my preparation for the DP-900 exam. This is the Microsoft Azure Data Fundamentals, part of a number of certification paths. You can read various posts I’ve created as part of this learning experience.

    I didn’t think much of this bullet on the DP-900 skills document: describe analytics techniques.

    Learn these concepts. They are definitely part of the knowledge needed. This is a part of some MS Learn courses, like this one.

    Descriptive Analytics

    Descriptive analytics have to do with describing what the data shows. In a report or visualization, we are reporting data to the user. An example of this is showing the top 10 products according to sales.

    These are explanatory analytics and think about that in the test. Are we explaining something.

    Diagnostic Analytics

    A diagnosis is an explanation of why something happened. Diagnostic analytics help explain the reason that something occurred. We might look at the top 10 sales against advertising for products and determine that more advertising shows higher sales.

    In the link above from MS Learn, what we typically do here is identify some anomaly or thing we want to explain, get data related to this, and then use some statistics to find a relationship.

    Predictive Analytics

    As you might guess, this type of analytics relate to the future. We are looking to predict what will happen. An example might be forecasting future demand for services.

    When you see a request to predict, forecast or extrapolate, think predictive analytics.

    Prescriptive Analytics

    This type of analysis was a little harder for me to understand or grasp. I get the general idea, but in prep I missed this one a few times. Prescriptive analytics are developing a prescription for how to change something.

    An example might be if I want to find where to cut costs to impact profit, I am looking for a set of things to change. I need a prescription on what will help me achieve my goal.

    In relation to the exam, this has to do with aiming for a goal (10% more or 12 less) and how to reach that goal. If you see specific numbers, usually that relates to a goal and prescriptive analytics.

    Cognitive Analytics

    This type of analysis has to do with thinking. In data analysis and computing, usually I think ML, AI, or some other type of data mining. This can be deriving conclusions or inferences from data, but the blend between this and the descriptive/diagnostic stuff becomes blurry.

    If you need to do speech to text or video transcription or image recognition, think cognitive.

    Summary

    This is how I viewed this techniques on the exam when answering questions:

    • Descriptive
      – What

    • Diagnostic
      – Why

    • Predictive
      – What will happen

    • Prescriptive
      – What do I do

    • Cognitive – Learning about data in new ways
  • Challenging Trends

    I was studying for the DP-900 exam recently and in one of the Microsoft resources, I ran across this quote: “Historical data is equally important, to give a business a more stabilized view of trends in performance.” This was in context of looking at database performance, but it would apply to any part of your business.

    The world has changed dramatically in the last two years. In early 2020, at this point, I was finalizing work and getting ready for a sabbatical from work. I managed to get the last sabbatical before the world shut down and most people didn’t see the value of one during a pandemic. I returned from sabbatical, with a trip planned to the UK in early March that I canceled. Since that time, I can’t imagine the quote above applies to the airlines’ business. I’ve flown a bit across the last year, but rarely for work. I suspect most of their models and ideas about how to manage their business had to dramatically change.

    Is that quote still applicable to your business? I wonder how many businesses have started to see new trends and needed to abandon some amount of historical data from their charts and graphs. If that’s the case, then is it worth archiving some of that data away, rather than needing to keep it in an online database? Do reports need beginning default dates that start sometime after the pandemic affected the world? Interesting questions.

    For most of us, we don’t necessarily worry about a lot of business impacts. We’ll adjust to what the business analysts ask us to do. However, I wonder if the way you approach your job has changed? For DBAs, have you reset your baseline for how the performance of your systems ought to look during normal times?

    For software developers, many of you are working remotely, so how do you approach work and coordination with others, has that changed? Do you need more or less lead time to work with others and get code tested and deployed? I know many developers have found work during the pandemic, especially remote, to be more enjoyable.

    Lots of things in the world changed, but much of our work continues on the same path. Approaching things with the idea of adapting to change, but using the past as a guide is what has worked well for me. I have strong opinions on how I work and live, but I adapt when there’s a need or evidence to support changes.

    Steve Jones

    Listen to the podcast at Libsyn, Stitcher, Spotify, or iTunes.

  • End of the Year Stats

    I track some data from my life, some purposefully, some randomly from various services. Here are some areas to look back at this year.

    Reading

    I read a lot. It’s an escape for me from a busy life and a good hobby. I track my books on Goodreads and tag the ones I finish with the year in which I finish them. As of a couple days before Christmas, I was at 117 in the 2021 tag. Quite a bt of growth in books read:

    • 2021 – 117
    • 2020 – 82
    • 2019 – 128
    • 2018 – 79

    Before this I wasn’t tagging.

    Fitness

    I try to work out regularly. A few items from 2021

    • 328 workouts
    • 118,736 kcal burned
    • 225:32 hours working out
    • 319 miles of distance. Unfortunately yoga and weightlifting don’t cover distance Winking smile

    Not a great year, but not bad. I was hoping to be above 365. I tend to do do things on weightlifting days, so I’ve missed too many days this year.

    Music

    I love listening to music. I’ve had lots of music players, and went with an iPhone a few times specifically because the music support was better. These days I am mostly on Spotify, which is a fantastic service for me. It’s in the Tesla, on my devices, and I’ve got stuff playing often.

    I love the wrap up from Spotify this year. A few stats:

    • 33,449 minutes listening
    • Top song – 3 Nights (36 listens) (also Old Town Road, California Dreaming, Who Says, and Short Skirt)
    • Top artists – John Mayer (2,243 minutes), with Beatles, Jay-Z, Notorius BIG and Stevie Wonder rounding out the list.
    • Top genre – Classic Rock (lots of guitar riffs I like here)

    Language

    • 30,043 XP (experience points)
    • Top 1% of learners
    • French and Japanese
    • 5978 minutes learning (99.6 hours)
    • 85 minutes on one day
    • 1074 words learned, probably more Japanese
    • 334 days when the stats came, 575 days on a streak. I used 2 streak savers in 2021, 3 in 2020, so not really all those days.
    • 258 days in the Diamond league (top league)

    I got this icon/image/prize:

    2021-12-06 09_44_49-YEAR IN REVIEW

    Travel

    With the pandemic still going on and not many events, I didn’t think I’d travel much, but I ended up with a good year.

    • 12 trips for me
    • 1 new country (Belgium)
    • 1 UK trip
    • 3 trips to Florida
    • 5 work trips
    • 48 trips according to Google

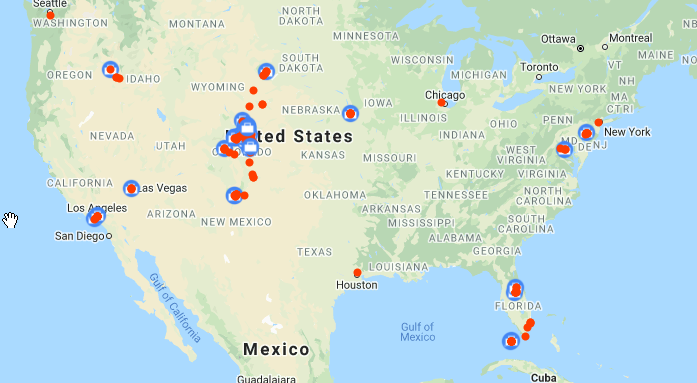
    The spread in the US:

    2021-12-20 15_41_25-Timeline

    We ended up with 4 or 5 trips in the living quarters, camping out in various places.

    20210727_202028

    Not bad, and hoping for more in 2022.

    I also renewed my United 1K status. With a few trips and some promotions from them, I ended up back at the top tier that can be earned. That’s good as I hope to get back to more travel in 2022 and would prefer to get upgrades across the ocean.