Tag: dp-900

  • Power BI Dashboards

    This is part of a series on my preparation for the DP-900 exam. This is the Microsoft Azure Data Fundamentals, part of a number of certification paths. You can read various posts I’ve created as part of this learning experience.

    I don’t know a lot about Power BI. I’ve lightly hacked and played with it, but it has evolved and changed so quickly that I needed to dig into some concepts.

    Power BI Dashboards are a part of what you need to know for this exam. Over the years, I’ve lightly made a few reports, but not dashboards, so this was an area I needed to study up on a bit, especially these concepts.

    Dashboard Basics

    A dashboard is different from a report. A dashboard is

    • a single page
    • available in the Power BI Service only (not Power BI Desktop)
    • composed of tiles
    • can use data from one or more reports, and more than one dataset
    • one dashboard can be featured
    • supports natural language queries
    • can’t see the underlying data, but can export data

    Tile Sources

    A tile can be from:

    • a report (a visualization)
    • another dashboard
    • an Excel workbook in OneDrive for business
    • Quick Insights
    • An on-premises paginated report from Power BI Server or SSRS

    There can be standalone tiles for  images, text boxes, video, streaming data and web content.

    These are a series of facts I think are important to understand about Power BI Dashboards

  • ETL v ELT

    This is part of a series on my preparation for the DP-900 exam. This is the Microsoft Azure Data Fundamentals, part of a number of certification paths. You can read various posts I’ve created as part of this learning experience.

    I don’t have an ELT tag, and I’m not likely to make one. I tend to think of ETL as loading data somewhere, even though I know it means more.

    The important concepts for DP-900 here are that ELT is becoming more important and you need to understand what this means. I’ll cover these concepts, but also give a little overlap with where the different Azure services fit in with this.

    ETL

    For most of my career, the pattern for loading data was Extract-Transform-Load. In this pattern we:

    • grab data from a source
    • make changes to clean/change/etc.
    • write to a target (or sink)

    It’s how tools like SSIS work. They connect a source to a target and have a bunch of tasks or transforms in the middle that change the data in some way.

    This is a good pattern for getting the work done when the target system is just built for querying data, such as a data warehouse. It is also good when you need to scrub some data, perhaps for privacy reasons.

    This isn’t a good pattern when you are trying to load data quickly as the transform process takes time.

    ELT

    This is the new way of doing things. I this patter we Extract-Load-Transform, though really, it’s not a pattern that quite makes sense in that the process of moving the data just moves it.

    Here we:

    • grab data from a source
    • write it to a target

    Where’s the transform? Well, that happens on the target, often when someone queries the data. Modern analytic systems, like Snowflake and Synapse, can work with vast quantities of data, often stored in a data lake or blob system, and consume that with powerful computational capabilities. There could be some minor re-shaping of the data on write, but that’s not the idea.

    This is good when you might not read all the data. Why process (transform) what isn’t being read. Before you complain that you should know what is used, none of us know if all our data is being used. Unless we write crappy SELECT * code with no WHERE clauses.

    This is also good when we need to work at speed and privacy isn’t a concern. It’s great for the known formats of files sent to us, as the target system can project a table on top of a ser of files.

    ELT seems to be the current future direction of many analytical and warehouse systems.

  • Data Analysis Techniques

    This is part of a series on my preparation for the DP-900 exam. This is the Microsoft Azure Data Fundamentals, part of a number of certification paths. You can read various posts I’ve created as part of this learning experience.

    I didn’t think much of this bullet on the DP-900 skills document: describe analytics techniques.

    Learn these concepts. They are definitely part of the knowledge needed. This is a part of some MS Learn courses, like this one.

    Descriptive Analytics

    Descriptive analytics have to do with describing what the data shows. In a report or visualization, we are reporting data to the user. An example of this is showing the top 10 products according to sales.

    These are explanatory analytics and think about that in the test. Are we explaining something.

    Diagnostic Analytics

    A diagnosis is an explanation of why something happened. Diagnostic analytics help explain the reason that something occurred. We might look at the top 10 sales against advertising for products and determine that more advertising shows higher sales.

    In the link above from MS Learn, what we typically do here is identify some anomaly or thing we want to explain, get data related to this, and then use some statistics to find a relationship.

    Predictive Analytics

    As you might guess, this type of analytics relate to the future. We are looking to predict what will happen. An example might be forecasting future demand for services.

    When you see a request to predict, forecast or extrapolate, think predictive analytics.

    Prescriptive Analytics

    This type of analysis was a little harder for me to understand or grasp. I get the general idea, but in prep I missed this one a few times. Prescriptive analytics are developing a prescription for how to change something.

    An example might be if I want to find where to cut costs to impact profit, I am looking for a set of things to change. I need a prescription on what will help me achieve my goal.

    In relation to the exam, this has to do with aiming for a goal (10% more or 12 less) and how to reach that goal. If you see specific numbers, usually that relates to a goal and prescriptive analytics.

    Cognitive Analytics

    This type of analysis has to do with thinking. In data analysis and computing, usually I think ML, AI, or some other type of data mining. This can be deriving conclusions or inferences from data, but the blend between this and the descriptive/diagnostic stuff becomes blurry.

    If you need to do speech to text or video transcription or image recognition, think cognitive.

    Summary

    This is how I viewed this techniques on the exam when answering questions:

    • Descriptive
      – What

    • Diagnostic
      – Why

    • Predictive
      – What will happen

    • Prescriptive
      – What do I do

    • Cognitive – Learning about data in new ways
  • Azure Redundancy for Storage

    This is part of a series on my preparation for the DP-900 exam. This is the Microsoft Azure Data Fundamentals, part of a number of certification paths. You can read various posts I’ve created as part of this learning experience.

    In a previous post, I discussed the makeup of Azure regions and Availability Zones. These are important concepts to understand how storage protection works. This post looks at the various redundancy types: LRS, ZRS, GRS, and GZRS and RA-GZRS.

    Note: This isn’t directly on DP-900, but these concepts did help me understand better how the Azure options fit together.

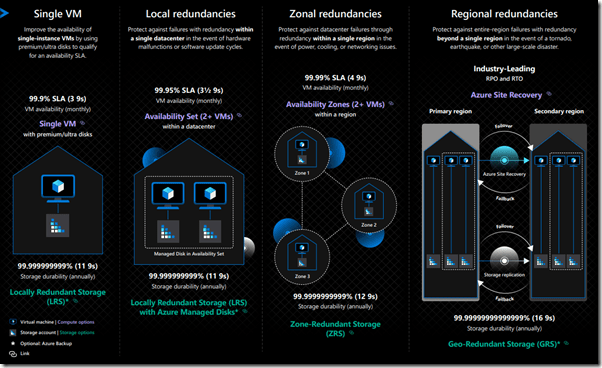
    As I discuss these, this infographic might help. Also, MS Docs has an article.
    2022-02-04 09_43_49-Azure Resiliency Infographic_PostFinal

    Local Redundant Storage – LRS

    As it might imply, this means that your storage bits are copied synchronously to redundant storage in the local area. In this case, this means the data center where your  storage is located. Your files (or VHD or whatever) is copied three times into separate locations. This means that your files can survive a single node (computer or disk) failure.

    This also means you should forego software RAID for VMs or data files as there are already three copies that will acknowledge the write.

    You do not get to pick which data center, just the region where the data center lives. This means your resource could be in any of the data centers in a region, but there are three copies.

    Impressively, this gives you 11 9s of durability. However, a fire or major failure of a single data center might cause all your data to disappear.

    You can use managed disks with LRS.

    Zone Redundant Storage – ZRS

    The next level of protection is ZRS, where you get three copies, but this time the copies exist in three parts of an Availability Zone. This is why the AZ must be inside a 2ms latency boundary. This way your files can be copied from data center to data center inside of the AZ.

    In this way you achieve 12 9s of durability for your files. More importantly, if a single data center were to go offline, you would still have access to your files (or VHDs).

    You can use managed disks with ZRS.

    Geo-Redundant Storage – GRS

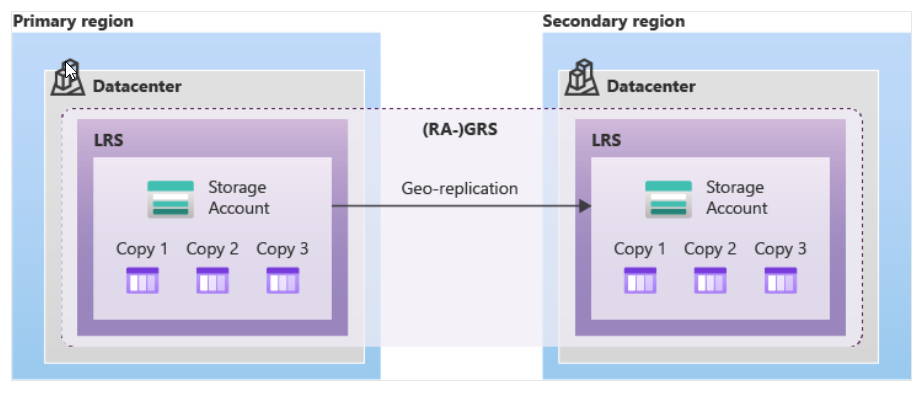
    This is a type of redundancy that is between LRS and GZRS. In GRS, the primary data center implements LRS, with 3 copies of files in the single data center. This gives you protection against node failures.

    A second copy, asynchronously, is made in a second region, where LRS is also implemented. This means 6 copies of your data, spread across 2 data centers, one in each of two regions. The image below shows this:

    2022-02-04 10_18_30-Data redundancy - Azure Storage _ Microsoft Docs

    Note, the files in the secondary region are not accessible unless there is a failover. However, if you add RA-GRS, the read access equivalent, you can access files in either zone.

    Geo-Zone Redundant Storage – GZRS

    GZRS expands the ZRS storage to include a second region. You still get three copies in your primary region spread out across an AZ, but you also get three copies in a secondary region. These are replicated asynchronously as the latency between regions isn’t bounded closely enough for synchronous changes.

    The secondary zone uses LRS for the copies. The difference between GRS and GZRS is the replication in the primary region.

    GZRS is supposed to give you 16 9s of durability.

    Read Access Geo-Zone Redundant Storage – RA-GZRS

    With GZRS, there is more protection for your files, but you cannot access the files in the secondary region unless you fail over from the primary region. The customer or Microsoft can initiate this.

    In some cases, you might wish that you could spread the read workload between the primary and secondary regions. With RA-GZRS, you can do this. Your clients can access files in the secondary or primary region.

    Availability of Azure Storage Options

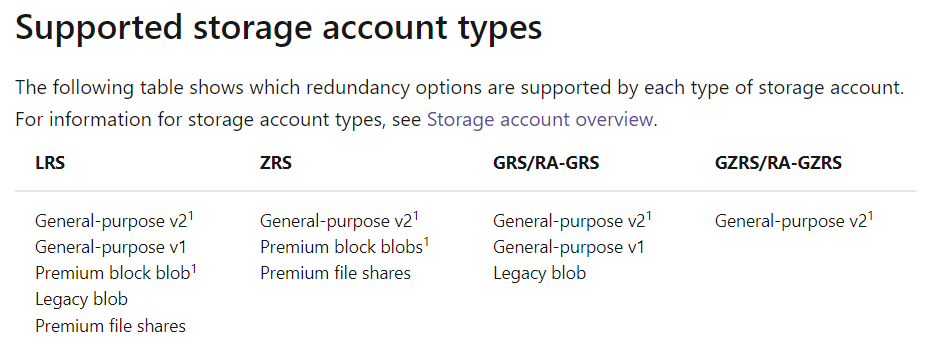
    Not all Azure Storage options are available with the different redundancy options. In the redundancy article, there are two charts, I’ve reproduced below. This first one looks at the different redundancy options and which types of storage fit:

    2022-02-04 10_24_53-Data redundancy - Azure Storage _ Microsoft Docs

    This next one shows that the different account types fitting in the options.
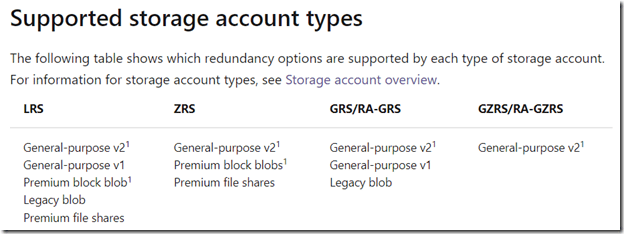
    2022-02-04 10_25_14-Data redundancy - Azure Storage _ Microsoft Docs