Tag: data analysis

  • Enhancing Client Experiences with Data and Analysis

    I love sports. The idea of competing and testing yourself against others (and against yourself) is something I’ve enjoyed for most of my life. Often it hasn’t even been important who wins; it’s the experience of competing. I don’t compete much anymore, but I enjoy watching and coaching sports. Teaching a group of younger people to work, train, win, lose, and enjoy sports is very fulfilling.

    I take statistics when I coach, and I provide those to my athletes regularly. The data is helpful for them to understand their performance and how they compare to others. The numbers don’t drive my decisions, or theirs, but they do provide feedback for them about overall performance. Sometimes stats help me keep perspective; sometimes they remind me of something I’ve forgotten. Sometimes they help me realize a mistake is an outlier and not where I ought to focus.

    I ran across an article on how data is being used in more professional sports. This post isn’t about the numbers of the game, but rather the ways in which data enhance the experience for fans. From resource needs to marketing to predictions, data is important to success in large events. The data can also make the fan experience better.

    Most of us are data professionals, and we know the power of data. Many business people know that data can be helpful, after all, they usually give us a never-ending queue reports to build. I think many of these business professionals can struggle with thinking more widely about how to proactively use data in planning, preparation, and prediction. These are things that data professionals have been doing for years, before the current AI/ML fad. We often used past data to help us prepare for the future. I’m not against AI/ML, but I don’t think they are necessary for all predictions.

    Data professionals know that we can use data in many areas of life outside of sports to enhance software for the client experience. I know I enjoy seeing some of the technology advancements that add to the experience from software, and I appreciate those that provide excitement to an experience, as well as those that just ensure things run smoothly. I look forward to seeing what the future might bring as some of the incredibly creative people out there begin to use data and technology to try out new ideas.

    Steve Jones

    Listen to the podcast at Libsyn, Stitcher, Spotify, or iTunes.
  • Cleaning Up Stats Data for Volleyball

    One of the things I’ve done the last few years is collect statistics as a coach for the kids I work with. Helping them understand how they are performing in competition is important, and it’s a good way to see if we are actually improving play.

    I use paper and pencil to gather data, because it’s reliable and quick. Most of the apps I see try to prevent bad data by enforcing certain flows of data, but I find this often means a mis-press on a tablet screen results in lost data because the game moves too fast. The apps aren’t flexible, either, so it’s hard to grab practice data.

    Last year I collected data like this:

    2021-06-01 14_23_21-TeamStatsByGame.xlsx - Excel

    I’d total data and then drop it in the spreadsheet, with a formula to calculate percentages. I report this to athletes and parents, which worked well. However, I wanted to build some graphs, which this format doesn’t make easy to consume.

    Putting Data in a Table

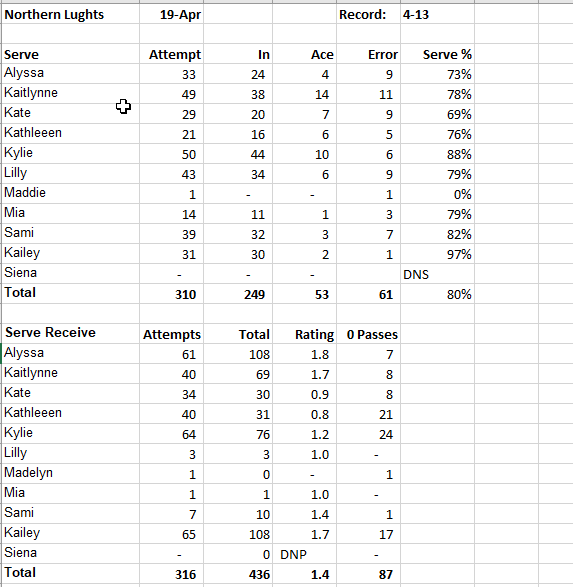
    My kids and parents don’t have a database tool, so I need to give them raw data in Excel. That works well for all of them and they can read the data. This year, I decided to give them a similar “dashboard” of data for each competition. The format I chose looks like this:

    2021-06-01 14_30_42-Stats2021_15Select.xlsx - Excel

    Not the best format, but it is easy to print and discuss with players.

    For more extensive reporting across the season, however, I need to capture data in a different format.

    As a result, when I take data from my paper and enter it, I do so in a separate worksheet in the same file, but in a tabular format. Here’s a sample of one of my sheets. This one captures Serve data.

    2021-06-01 14_32_57-Stats2021_15Select.xlsx - Excel

    For a particular tournament, I use a formula to add up the data for each player. Since I store the data for players in the same order each time, I can easily create a formula for 1 player and then copy/paste that for other players. It’s a little manual work, but it goes quite quickly as I go through the data after a tournament.

    Next Steps

    The goal from here was to publish this data as an interactive report. I want to build a PowerBI report and then make it available, but that’s for another post.

  • Data Analysis Without a Server

    Most of us that subscribe to this site are data professionals, and we work with large amounts of data for our organizations that is usually stored on a server class system, with TB sized, high performance storage systems. Whether on premises, in the cloud, or another data center, our employers have made an investment to provide high quality data services for our clients. This large investment is often a big decision, and setting up a new system to handle lots of data as an experiment with data analysis can often seem to take ages.

    The R language has been popular for data analysis for years, though the data sets examined were often limited in size, usually because of workstation limitations. One of the reasons Microsoft added R services to the data platform was to move analysis closer to big stores of data and increase the ability of organizations to “operationalize” or deploy their analysis and models to a wider audience.

    Deciding when to make that investment can be tricky, but the more that someone can prove some value from a smaller experiment, the more likely it is that an organization might decide to move forward. Recently, I ran across an interesting article, where the author had analyzed a billion row dataset on a commodity laptop. In this case, a Macbook Pro costing US$4000, but that’s a pittance compared to deciding to invest in HDFS storage, a Big Data Cluster, or even a large cloud experiment.

    What caught my eye here is that the analysis tool used, OmniSciDB, was engineered to run on CPUs, not GPUs, and performed very well in analyzing the data. I haven’t found the time or set up the disk space to try and load the billion rows into a SQL Server columnstore index, but I’d be curious how that might perform on the same data. The queries run are fairly simple aggregations, and my guess is SQL Server would perform extremely well once the index was built. If someone else wants to try it and take notes, I’d love to read the experiment as an article on SQLServerCentral.

    It has become more and more likely that before we embark on any large project in an enterprise that we perform some sort of prototyping and development on a small system. I think that’s true whether we’re building a web app or setting up a data science experiment that might drive our business forward. I always enjoy reading when someone has run tried a large scale analysis experiment on a workstation, not a server, and I hope we continue to see more people doing this and sharing their results in the future.

    Steve Jones

    Listen to the podcast at Libsyn, Stitcher or iTunes.

  • Learning some DAX

    I’ve not done much BI work in my career, other than simple aggregates in reports. I’ve wanted to tackle projects, but I’ve rarely had a chance to spend time in this area at work.

    Recently I had a bit of time and decided to look at some Power BI courses.  At Pluralsight, when searching Power BI, I got a learning path that showed a number of courses from different authors. In the intermediate track, the first course was from Eugene Meidinger.

    2019-12-09 13_40_32-Microsoft Power BI for Analysts Path _ Pluralsight

    I met Eugene last year at SQL Saturday Pittsburgh and decided to give his course on Getting Started with DAX Formulas in Power BI, Power Pivot, and SSAS. Not quite what I wanted, but since I was curious about DAX, I decided to give it a try.

    Understanding DAX

    The intro is interesting. Eugene makes a good case for why DAX is important in the Microsoft stack. I tend to agree as I see this being incorporated into many products, including Excel. I’ve felt somewhat out of touch in that I haven’t known much about it and how it works. Even when I flip through our Stairway series, I’m somewhat skimming and haven’t really understood what it means.

    I think Eugene does a good job of trying to explain DAX as different than, but similar to Excel. Thinking of this as an expression language, rather than a query language, isn’t something I’ve considered. Maybe I’ve heard this, but it didn’t stick.

    He also lets me know this isn’t easy, which is what I’ve thought. I’ve seen Bill Pearson and Reza Rad talk some DAX, and it wasn’t quite clear to me. It felt clear when they were speaking, but not later. I’m hoping Gene teaches me a bit more in my office rather than in a 1 hour session.

    Going Through the Overview

    I went through the first few modules, which give you an overview and basic understanding. Eugene tries to explain the differences between DAX and SQL, which is a good way to approach the problem. Many of us are familiar with SQL, so this is helpful.

    The third module starts to get into data governance and where you use DAX with your data. This is interesting, and it’s a good look at what type of organization you deal with for data. How is your data managed, which is something that most companies don’t really have a good, or consistent, data governance strategy.

    One good thing is that Eugene explains  the different places where DAX is supported for queries. That’s good since I’ve been thinking of DAX as the Power BI language, but it’s not. It can be used in Excel with PowerPivot.

    The fourth module is the one where we start to understand column storage and the value this gives us. Still no DAX, but it’s a good module for analysts and relation people.

    In getting through 4 modules, no real technical stuff that’s helped me, but it’s given me a little better baseline.