Tag: monitoring

  • New Tagging in SQL Monitor to Keep Organized

    I recently got an update from the SQL Monitor PM on the progress we’ve made across all the teams. We have a number focusing on different aspects of the product, and they’ve built an impressive produce over the years. I remember when it was SQL Response and only provided alerting. Now it’s an Enterprise Monitoring solution for SQL Server.

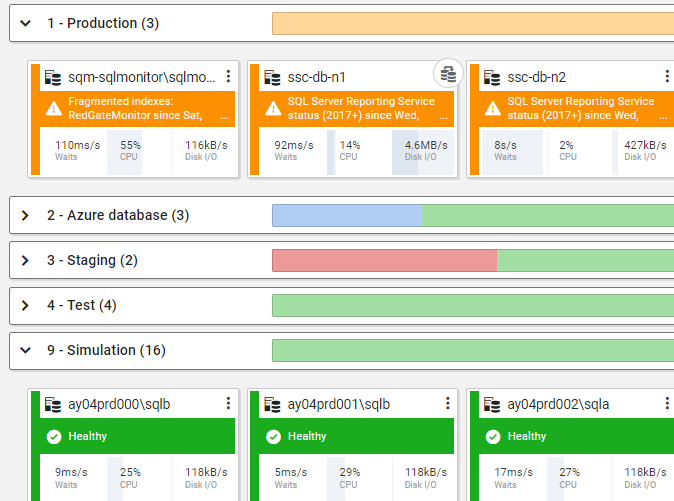
    One of the additions that was added across the last few months is tagging. Traditionally the monitored instances and databases are organized in categories, which is OK, but very limited. Below you can see at monitor.red-gate.com that we have instances in various categories: production, azure database, staging, test, and simulation.

    2022-02-10 12_12_40-Global Dashboard

    Tagging is a much more flexible structure that makes it easy to classify and filter your estate. There are plenty of cases where you might not only have an instance set as Production, but perhaps it’s a US or UK server and you want to know the geography. Maybe there is a need to know this instance also relates to CRM v a data warehouse system. Tagging makes that easy.

    Filtering with Tags

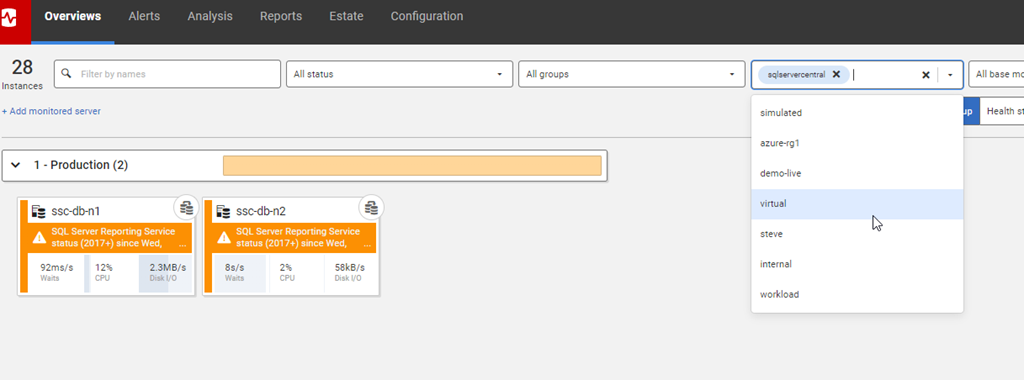
    At the top of the global dashboard shown above, there is a new filtering area where we can filter by tags. You can see below that I’ve filtered the 28 instances in our demo setup to the 2 that have the “sqlservercentral” tag.

    2022-02-10 12_15_45-Global Dashboard

    What’s more, clicking in the tag box shows me the existing tags that are applied.

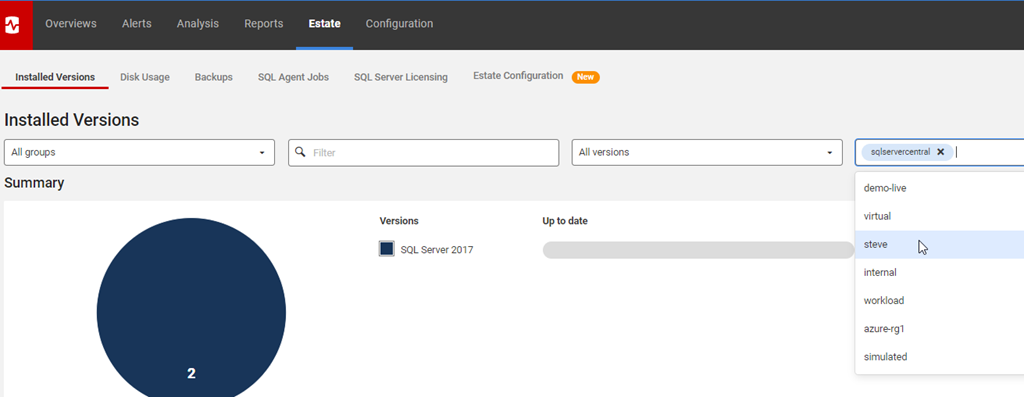
    Tagging is also available on the Estate tabs.

    2022-02-10 12_28_55-Installed Versions

    There are a few other places, and it’s slowly making its way across the product to all areas. You’ll see it slowly appear in other places as well.

    Adding Tags

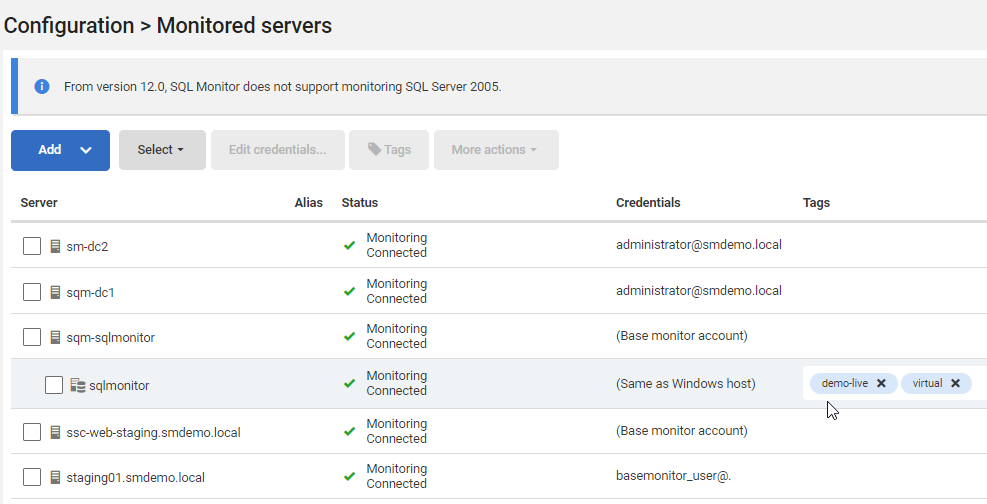
    You can add these in the Server Configuration, which works fine. Pick a server and then you can add tags that correspond to what you care about.

    2022-02-10 12_48_21-Monitored Servers

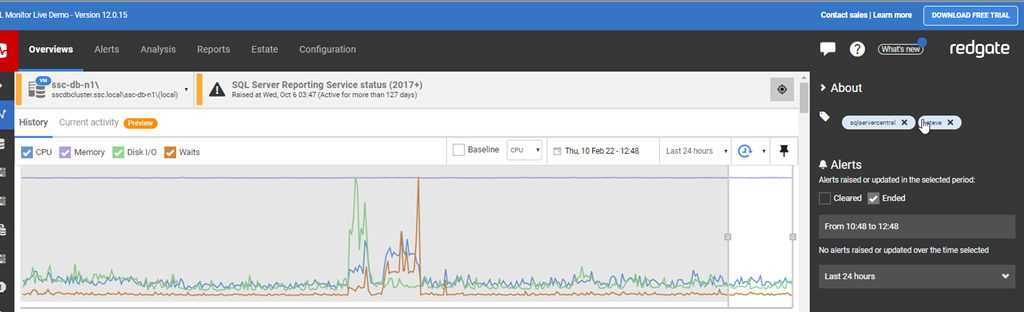
    If I’m working with a server in the overview, I can also expand the right Alerts panel and in the top About section, I can adjust tags. A good way to fix these up as you work on issues.

    2022-02-10 12_48_55-ssc-db-n1_ - Server Overview

    Look for tagging to make it’s way into the PowerShell cmdlets as well.

    There’s a post on the Redgate Blog about tagging as well. They are looking for feedback, so please send it along.

    If you haven’t used SQL Monitor, it’s a great tool to help you keep an eye on your estate with minimal effort. You can get alerted of issues and even integrate with other tools. Download an eval and give it a try today.;

  • Knowing When to Respond

    I ran into this quote on the Microsoft Learn site, which I thought was a great way to think about how to administer a system: “Without a baseline, every issue encountered could be considered normal and therefore not require any additional intervention.”

    When I’ve had users file tickets or complain about things not working well, I’ve found more often than not their perception has changed more than the actual performance. I’ve been called for “slow applications” only to find out that “slow” was 30 seconds and the complainer wasn’t sure how long it used to take, but today being end of the quarter, it is slow. Digging into monitoring history has shown that the query always took at least 20s and could take over 30s. My main takeaway was a little stress for users sometimes culminates in unnecessary work for operations staff.

    There certainly are times when a database query takes longer than expected but is it because the system is overloaded or there’s a lot more data? When was the last time this ran and what changed? Are there more queries against the same objects than in the past? Even when there are real problems, without knowing how a system typically looks at this time, we may struggle to quickly determine where the problem lies. We may not even know how to craft a good solution without some baseline.

    Maybe the best reason for me to know a baseline is for triaging and prioritizing issues. Seeing a server at 100% CPU is one thing, but if this is a daily occurrence, I might decide another issue is more important. Especially at 2 am.

    Having a baseline for your systems is important. Build a system if you must, buy one if you can, but get monitoring set up for your systems. It will help you focus development efforts when changed code doesn’t work as expected. It also helps your operations staff to help them respond more efficiently to future issues.

    Steve Jones

  • Data and DevOps Predictions for 2022

    All the Advocates at Redgate (Kathi, Grant, myself) got asked about some of the future predictions we might have, based on some of the data from The 2021 State of Database DevOps and The 2021 State of Database Monitoring. We each came up with a few things and then someone summarized them. Grant has an official blog post, but I thought I’d glance through the summary, see what the others wrote, and then come up with a few things.

    Side note: I hope to review this next January and see how I did.

    I didn’t do this last year, but I’m going to separate the DevOps and monitoring topics and give a few thoughts on each.

    DevOps

    DevOps continues to grow and really become almost a mainstream idea. I don’t know if I think the majority of companies are really adopting much of it, but many are adopting something. I rarely need to explain DevOps, though I do often need to define it for me and level set how I view it. It still seems everyone things about this differently.

    The main challenges for DevOps are adding automation, moving to the cloud (or hybrid) and writing better code. DevOps can help with all these things, but I think far too many organizations still want to tackle these are projects, not an ongoing habit.

    Well, all but the last one. It seems no one really prioritizing better code in most management I encounter.

    Automation is the easiest of these, and I find that more and more DBAs are embracing automation in different ways. Some still want to do everything manually, but more of them are starting to accept that a framework (like Flyway) or even a simple automated script runner can be used without them needing to connect with SSMS.

    I see this as a trend that will continue to increase, and eventually we’ll expect 95% of all deployment code to run with an automated process of some sort. Bt process I mean you aren’t connecting to a production server from your workstation.

    My prediction for 2022 is also that I won’t see anyone create new repos in a version system other than git. I do tend to work in the MS stack or the Flyway area, and I don’t expect to encounter any clients still trying to work with SVN, CVS, Vault, Perforce. or even TFVC. Any why should they?

    I also expect that we will see more cross platform work from everyone, which means that we will want a fairly consistent way of managing development, whether this is on SQL Server, Oracle, PostgreSQL, or MongoDB. I know that deploying code here means more chances for mistakes, so having a consistent high level process is important. This might mean that you use one type of framework for SQL Server and another for PostgreSQL, but the flow will be the same. Save code, run CI, deploy with automation. Hopefully testing in there somewhere.

    The cloud encourages automation, but not completely. The portals are complex, the offerings changing, and no one wants to worry about which version of a CLI you have on which machines. Still, I hope to see more GitOps or Infrastructure as Code used by clients.

    Monitoring

    I think two things here. First, people are going to rely more and more on monitoring systems to manage the disparate and ever-growing estates of data stores they have. This is going to come about with the problem for many people of not only managing different platforms, but also different monitoring tools.

    People already struggle with SQL Server and Oracle (or any other combination of platforms). I expect they will have AWS and Azure to contend with as well, though likely each organization will lean more heavily on one than the other. However, they’re also going to be dealing with different products for different platforms.

    I predict some stress, confusion, and anxiety about incidents and employees trying to decide how to find and use information.

    The second prediction is that we are going to see another security issue with a monitoring and/or management platform. We had a big one last year, but I bet hackers are working out how to attack other platforms, especially those that require sysadmin privileges and also allow the tools to change the remote systems.

    Security is always a problem and after last year’s incident, I expect other software to be targeted in this same way.

    Looking Forward

    If you are trying to find a new job, or improve your career, here’s what I suggest. First, learn to write and speak. However you can, but working with others, advocating your position, and improving your showing at interviews will matter.

    In terms of tech, get good at something but learn a bit of many things. Pick a cloud and learn how the general infrastructure of IaaS, PaaS, and SaaS work. Things will vary a bit from Azure to AWS to GCP, but the core remains the same. Learn how to spin up and work with a variety of technologies related to data. Be comfortable with version control, with repos, with CI, with CLI tools, with finding answers on how to accomplish tasks. Knowing a bit and how to find out more might be a good way to answer some of those interview questions.
  • Incident Response Data

    I was watching a PoSh session at the PowerShell + DevOps Global Summit recently where a sysadmin had a series of scripts to run when there was a problem. One of these was Rapid Response, which gathers information from a machine(s) and stores it in a series of files. It’s a grab bag of various items, but the data can be used to help determine what’s wrong.

    Some of us have monitoring tools for our databases, and some don’t. I’m wondering, in each case, is there a set of data you want or need when an incident occurs? Do you have separate types of incidents that require disparate data? Perhaps you respond differently to performance issues than security incidents than hardware problems and want different types of data gathered.

    I know that in the past, I’ve often had scripts I ran to respond to some issues, but not others. I’ve also depending on monitoring systems (bought or built), but usually they don’t have all the information I need when something goes wrong. Capturing all the data I need in an incident is often too much to store for any length of time, but it is data that I need for specific issues. Having a series of automated processes that might start collecting data when an incident occurs, perhaps filtered based on an instance, database, user, or some other value, would be helpful. However, I think I’d need a lot of incidents to build the list of scripts myself for different issues.

    A crowd sourced series of scripts, developed by people responding to different problems, would likely be the best way to capture this information. I do see some good resources (PDF, GH) for certain types of problems, but in order for these to be useful to you, some knowledge and familiarity is needed. You need to know what scripts are useful in which situations.

    This is really the best reason for blameless RCA (root cause analysis) work after problems occur. If you have runaway blocking, constant security probes from unknown clients, or any other issue, it becomes important to analyze what happened and how people responded. Build up a protocol for how to respond and ensure that the knowledge is distributed to others that might need it. Practice running scripts and looking at information, perhaps even in a controlled replay of the problem.

    When an incident takes place, you’ll be glad you are prepared. Whether it’s small or large, a little practice will help you get through things more efficiently, and likely with less stress.

    Steve Jones

    Listen to the podcast at Libsyn, Stitcher, Spotify, or iTunes.