Tag: solar

  • Solar Projection v Estimates

    We got a solar system in 2022 to try and fix some of our power costs and hedge against the future. We were fairly confident it would work well, but weren’t 100% sure. So far, it has reduced our power bill quite a bit, though it’s a bit hard to tell right now if this is actually saving much money.

    However, the performance is above what was estimated. I’ve built a Power BI Report that tracks the actual production v the estimates. So fat, almost every month has beaten estimates and our power production is well above what we expected.

    Given the fact that power prices have increased in CO and I expect more increases to come, this is nice.

    I can’t embed the report here, but this is an image of the report:

    Power BI report of production v estimates

    I need to add some more costing here, but our current bill is often around $22/month, of which $13.50 is a connection charge. Usually we are paying around $8-12 of demand charges for peak usage from 4-8pm. Hard to get the family to slow down here, and there isn’t much solar during this time.

    This is, however, much better than last Nov/Dec, when we had $220 bills. Even with the loan payment, I think we’re paying less than in the past.

  • Solar Production After 5 Months in Power BI

    I’ve been tracking my usage and comparing that with the estimates for my solar power system. I wrote about the database design and tracking the usage and some of the estimates.

    In this post, I want to look at the reporting in Power BI. Here is my refreshed comparison report as of Jul 31.

    2022-08-01 10_17_38-SolarProduction - Power BI Desktop

    I have 3 sections here. At the bottom right is a table with a range setting that shows raw data. I need to write about the import process for this data, but that’s for another day.

    At the top, I have the running total of production (light blue) and estimated production (dark blue). The first month or so we were close to the estimate, but we started to outperform the estimate regularly, which is good news. The Tesla wasn’t in the model or estimate, and it uses some power, so it’s good the system is ahead.

    The bottom left is the month by month comparison, which you can see is a fairly steady overproduction each month.

    The configuration is fairly simple for this report. For the line chart, I’ve set the x-axis as the date. My Y-Axis has the sum of both of the raw production numbers. This gives me a running total across time.

    2022-08-01 10_32_02-SolarProduction - Power BI Desktop

    The lower left month by month bar chart is similar, but I’ve added the month, which separate this into buckets.  This lets me see if a particular month’s comparison is hidden in the line chart by the long term running total.

    2022-08-01 10_36_16-SolarProduction - Power BI Desktop

    I can’t change much, but this does help me to look for anomalies and possible production issues. Perhaps a panel isn’t performing or there is another issue. By glancing at this every few days, I can decide if I need to look at more detail on the system.

    Hopefully the company doing monitoring would detect issues, but this is a good double check for me and it also gives me long term data backup in case they have issues.

  • The Effectiveness of Solar Estimation

    We added a solar system to the ranch as a way to hedge against future costs as well as require less energy from the utility. I don’t plan to, or think, that everyone can get away from using utility power, but this is a way to control our finances for the future better, as well as reduce the load on the utility.

    When we designed the system, the company (Namaste) provided us with production estimates for each month of the year. I wrote about this in a database design post, but I wanted to update how things are going.

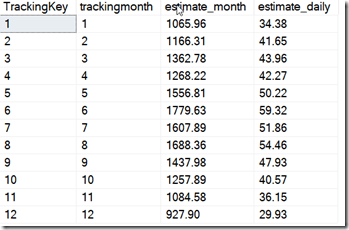
    The estimate for May and June were:

    • May – 1556.81kWh
    • June – 1779.63kWh

    Pretty specific, but based on our house, the system, and weather patterns, this is what they came up with. I have a real time tracking system, which I back up in my database, so I can keep a running total.

    For May, we had unusually dry, hot weather. Not good for the land or ranch, but good for power. We ended up producing 1830.28kWh. This was a surplus of 273kWh, or 5.4 extra days of power.

    June is still going, but as of the 20th, we had produced 1263kWh compared with a running total estimate of 1186kWh. It was interesting because the first half of June was mostly negative with some cloudy (and a little rainy) weather. Since the 12th,however, we’ve been on a sunny streak and have been building a surplus.

    I don’t know what this means for costs this year as we are supposed to have a surplus of power in the May-October time period and then draw more in the winter months. However, our power bills have been near the minimum charge for a connection to the utility. So far, I think we’ve made a good financial investment, but time will tell. I’ll continue tracking and hopefully continue to see positive results.

  • Comparing Daily Estimates to Actuals–#SQLNewBlogger

    Another post for me that is simple and hopefully serves as an example for people trying to get blogging as #SQLNewBloggers.

    In a previous post I wrote about using a few tables to capture information about my solar system. With a way to capture the data for each day, I now want to report on this. This post will look at the first part of my reporting, which is the daily reporting.

    Scenario

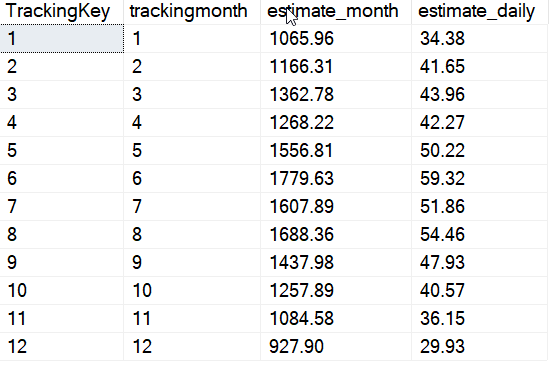
    On a daily basis, I want to know if the system is producing more or less than the estimate for that month. If you remember from the previous post, there is a single row in a table for each month and then a row in a different table for each day.

    My estimates look like this:
    2022-04-25 16_30_53-SQLQuery3.sql - ARISTOTLE_SQL2017.way0utwest (ARISTOTLE_Steve (63))_ - Microsoft

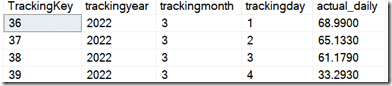
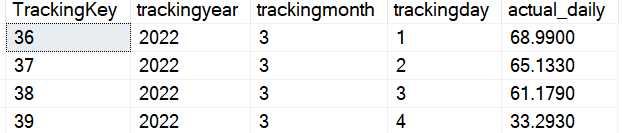
    Each day looks like:

    2022-04-25 16_31_19-SQLQuery3.sql - ARISTOTLE_SQL2017.way0utwest (ARISTOTLE_Steve (63))_ - Microsoft

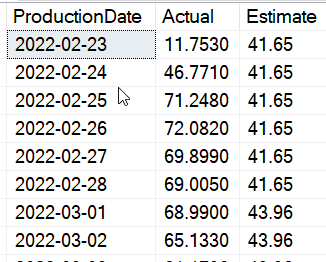
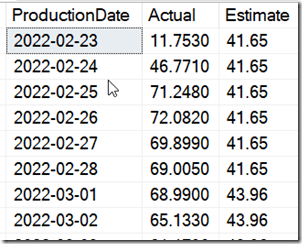
    What I want is a comparison of the actual output against the estimate for each day that I have data. I don’t want to see a number of zeros unless the system produced no power. What I really want is the estimate expanded to cover each of the days of the month for which I have actual data. I want to see this:
    2022-04-25 16_36_50-SQLQuery3.sql - ARISTOTLE_SQL2017.way0utwest (ARISTOTLE_Steve (63))_ - Microsoft

    A Simple Join

    This is very simple query to write. It’s really a join between the two tables, based on the month. If I join on month, then the data from the estimate is returned for each row of actual data where the month’s match.

    I can then assemble the date in the results using DATEFROMPARTS(). When I do that, I have this code:

    SELECT
       DATEFROMPARTS (spa.trackingyear, spa.trackingmonth, spa.trackingday) AS ProductionDate
    , spa.actual_daily AS Actual
    , spe.estimate_daily AS Estimate
    FROM
       dbo.SolarPowerActual AS spa
       INNER JOIN dbo.SolarPowerEstimate AS spe
         ON spe.trackingmonth = spa.trackingmonth
         ORDER BY ProductionDate

    This gives me the results I need, and it works well. Since I have numeric values for the months in both tables, this is a very quick join, especially when those columns are indexed. In this case, most of the time the index won’t matter as we really are pulling most of the data from one table and the tables are so narrow that the index might not ever help.

    I’ll compile this code into a view, which I can use for more detailed analysis.

    SQL New Blogger

    I was building this system to track some data, and decided to split up each section into a separate post. If you look at the first post and this one, you will see they are both short and could be combined, but I wanted to separate them into different topics, as well as schedule them separately.

    A good technique you can use on your blog to separate out topics and ensure a more consistent pipeline of content as you publish information about you knowledge.