Tag: syndicated

  • Better Presentations–Fonts

    This is part of a series of tips for speakers to make your presentations better.

    Please, please, please, learn how to set up your machine to look good on screen.

    I saw Brent Ozar write a few notes on how to make your presentations better recently. This was primarily for the people presenting at the PASS Summit, with a few specifics to that event. Buck Woody also had a mini rant about sizing the fonts on your laptop.

    Both are worth reading. The visual display of your work can overcome some poor speaking habits. Likewise, great speaking performances overcome some poor visual displays. Having both fail means your presentation may fail.

    Note by failure, I mean that the attendees don’t like the talk and lose out on information because they’re bothered by the way your session appears. This could be at a conference, a SQL Saturday, or a lunch and learn at work.

    Increase Fonts

    To move on from Buck’s post, change the defaults in SSMS. Paul Randal has a nice post on configuring SSMS. Read it and try it.

    I go for 14 point fonts, but note that you need to set Text and Grid results separately and restart SSMS. Do this before you walk in front of people.

    It’s easy to do in SSMS. Click the Tools and then Options menu items. You’ll get a dialog like this, and on the left, under Environment, there’s a Fonts and Colors selection. Click it.

    badpresent4

    The top drop down on the right controls the section of SSMS. Query Windows are the Text Editor items. Below this, I have a font (Consolas) and a size (14). Below that on the left I have the various items in the Text Editor I can change fonts for. There are so many settings that this could be a weeklong project.

    I usually just change the “Plain Text” to 14. I don’t’ worry about the others, but if you use other items in your presentation (like line numbers), change them.

    If you select the top drop down, you’ll see this

    badpresent5

    These are the other places you can change fonts. The two I want to point out (I use them) are the Grid Results about 2/3 of the way down and Text Results a few below that. Change both of these font sizes, though you’ll have to restart SSMS.

    If you make these changes, your attendees might not thank you, but they’ll be less likely to complain. Even in the largest rooms, 14 points seems to reach to the back of the room. And if it doesn’t, learn to zoom.


  • Silicon Valley is a different world

    I spent the last couple days at Flowcon 2014, a conference that is bringing people together to talk about growing their organizations with continuous delivery and design, and lean product development.

    It does some of that, but it wasn’t what I expected. The attendees for the most part were people that already believe in continuous delivery, in lean principles for their organization, and in flow. If you don’t know what flow is, read the Phoenix Project, Martin Fowler, and other lean, agile methodology books. It’s a concept from labor and manufacturing, with the idea that we can increase the rate at which we get work done.

    I believe in it, it’s a tenet of DevOps, and I think it works well. The conference features people from Netflix, Nordstrom, Etsy, Thoughtworks, and other companies that are already using these ideas. They believe, and they are looking for ways to better smooth out their own groups.

    However they also have ideas about rapidly changing and adaptive groups and organizations, which isn’t where most of us work. Far, far too many people are still stuck performing waterfall work, or even waterfall-like work.

    It’s also a world where people are looking for startup ideas, looking to move quickly and build something new. It’s a world that’s quite unlike my own. While there’s a buzz and energy from many people, it also feels somewhat shallow and hollow from some that are searching for riches. It’s also a bubble of thought that is so far away from most of my experiences, that it feels sheltered and idealistic.

    Don’t get me wrong, it’s exciting, and there is a passion some of these people have for their craft that’s inspiring. I’m just not sure it’s a place I’d want to be every week.

    However I do wish more and more people would look to better develop software. If we are to improve as an industry, I think many of the ideas and techniques that are invading the software development world related to flow need to be adopted.

  • Off to Flowcon 2014

    With all of the work on a deployment pipeline and Continuous Integration (CI) and Continuous Delivery (CD) I’ve worked on, I thought it would be instructive to go see how the software developers build their product better. A few months ago I noticed that FlowCon 2014 was coming to San Francisco. It’s a short, easy trip for me, a 2 day conference, and I thought it would be a good chance to interact with the Thoughtworks people, as well as others.

    So I booked the trip. Even though I travel enough, I rarely go for me, and this is a good chance for me to learn. I leave this afternoon, no commitments, no presentations, just the chance for me to learn a bit.

    I’m really looking forward to seeing how people are really making software happen faster, and at a higher quality level than in the past. I’ve read a few books in preparation for this, and it’s been interesting. The first one I really liked, though it has a lot to absorb. The second two were ok.

    continuousdelivery

    Continuous Delivery – Worth the read.

    51b0kaalNnL._BO2,204,203,200_PIsitb-sticker-v3-big,TopRight,0,-55_SX278_SY278_PIkin4,BottomRight,1,22_AA300_SH20_OU01_

    Refactoring Databases – Not bad, and certainly this gives some ideas for the challenges of database changes.

    510giluHAvL._BO2,204,203,200_PIsitb-sticker-v3-big,TopRight,0,-55_SX318_SY318_PIkin4,BottomRight,1,22_AA318_AA300_SH20_OU01_

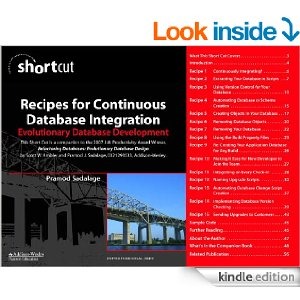
    Recipes for Continuous Database Integration – Meh

  • Crosstabs over Pivots

    I wrote about a basic PIVOT query recently. It’s an interesting way to write a query and turn row data into columns. That’s handy, and lots of people have a need for it. However I’d never used PIVOT in production code. I’ve always written a crosstab query instead.

    If I look back at the query I wrote, it looks like this:

    select
        *
      from
        ( select
              team
            , opponent
            , teamscore
            from
              scores results
        ) as rawdata 
    
    pivot
    
     ( avg(teamscore) for [Opponent] in ( [KC], [OAK], [SD] )
    
     ) as pivotresults;

    This gives me these results:

    team   KC   OAK  SD

    DEN    31   35   24

    However I could also write this query:

    select 
        'team' = team
    ,   'KC' = sum( case when Opponent = 'KC' then TeamScore else 0 end) / 2
    ,   'OAK' = sum( case when Opponent = 'OAK' then TeamScore else 0 end) / 2
    ,   'SD' = sum( case when Opponent = 'SD' then TeamScore else 0 end) / 2
     from scores s
     where team = 'DEN'
     group by team

    That gives me the same results.  The AVG item gets tricky as can don’t want zeros to be included in results. If there were a dynamic number of scores, I’d have to write a few subqueries to solve this issue.

    Which one is more clear and easier to understand? That’s a good debate. However I will say that if I need to add a column, I think it’s easier to do so in the crosstab.

    select 
        'team' = team
    ,   'KC' = sum( case when Opponent = 'KC' then TeamScore else 0 end) / 2
    ,   'OAK' = sum( case when Opponent = 'OAK' then TeamScore else 0 end) / 2
    ,   'SD' = sum( case when Opponent = 'SD' then TeamScore else 0 end) / 2
    ,   'NE' = sum( case when Opponent = 'NE' then TeamScore else 0 end)
     from scores s
     where team = 'DEN'
     group by team
    ;

    Here’s the PIVOT:

     select
        *
      from
        ( select
              team
            , opponent
            , teamscore
            from
              scores results
        ) as rawdata
      pivot 
       ( avg(teamscore) for [Opponent] in ( [KC], [OAK], [SD], [NE] ) 
       ) as pivotresults;

    I’ll also point out that Jeff Moden has written a few articles on this subject (Part 1 and Part 2) and his performance analysis shows that a crosstab performs better in almost all cases.

    I wouldn’t recommend one over the other. You need to test them both at larger than expected data sets to determine which one works in your situation.