Category: Uncategorized

  • A Live Conference Experience at Data Minds Connect 2021

    Last week I was privileged to attend a live conference in Belgium. dataMinds Connect 2021 took place in Mechelen, just outside of Brussels. I had submitted months ago, was accepted, but didn’t know I’d actually get to go until late September. However, I was glad I went.

    A Normal Experience

    I’ve been able to live parts of my life across the last year, but many things were limited in some way. Either I couldn’t do some activity I expected, or everyone was masked and separated. I’m grateful for what I could do, even with restrictions, but I’ve missed the world since 2019. The exception for me was a volleyball tournament in Orlando in June. It was a busy convention center without masks; the type of event I went to regularly the last few years.

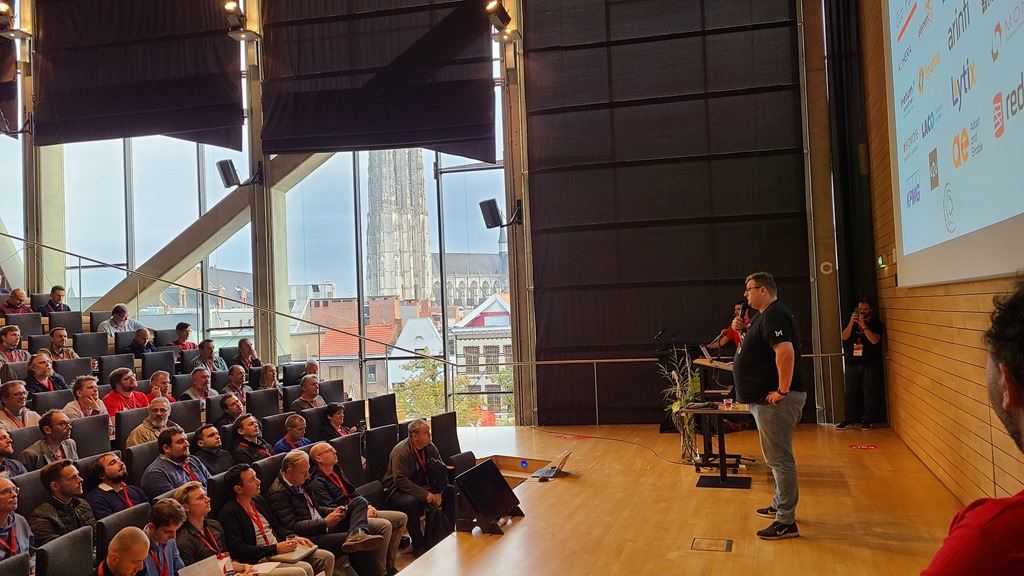
    dataMinds Connect 2021 was the first normal work event I’d attended since SQL Saturday #910 in Slovenia. This was a good sized event, 400+ people, and it felt good. People were interacting with each other, able to shake hands, see each other talking, and recognizing faces was a great experience.
    20211012_085015

    I enjoyed being able to chat with people in person, watch body language, meet new friends and see ones that I’ve missed.

    There were multiple sessions during the day, with 15 minute breaks for coffee or a snack. I got to speak in front of a good crowd, was able to see their reactions to my talk, and interact with them.

    Communication and COVID Rules

    I’ve had this event on my schedule for months, and I was happy with the way it was handled. Benni De Jaere (@BenniDeJagere) had emailed early with information on the event, venue, travel, and accommodations. A few months ago he contacted me again, asking if I was coming and giving guidance on the local restrictions.

    Just before the event, we got another long email with all the details of what we needed to be concerned about, how to get tested, quarantine rules, etc.

    While the event did not publish a specific policy, they did note they were deferring to local regulations. Since those can change, and even government sites can struggle to keep coordinated, this was fine for me. Grant (@gfritchey) and I were communicating, trying to decide the rules we needed to follow. I went through the border first, so I let him know about my experience and how to find the testing center and then our plans for quarantine.

    Foreign travelers needed to be tested and show vaccine proof. From there, the city where the event was held (Mechelen) was fairly open. Brussels was more restricted, and I wore masks and abided by their rules while there.

    I understand some people being concerned about safety under this pandemic. I don’t expect events to act differently than their local area. If they do, then they need their specific restrictions published. If not, then we are old enough to check the local guidelines and decide if those are acceptable to us.

    Overall

    I think Benni and his crew did a great job of setting up and running an event. Almost no one has done this in 18 months, and despite the delay, they smoothly handled a large crowd of people at entry and throughout the day.

    I thoroughly enjoyed the event, the people, and the area. I had never been to Belgium before, but it’s on my list as a place to come back to in the future, hopefully at another dataMinds Connect.
  • Daily Coping 24 Sept 2021

    I started to add a daily coping tip to the SQLServerCentral newsletter and to the Community Circle, which is helping me deal with the issues in the world. I’m adding my responses for each day here. All my coping tips are under this tag.

    Today’s tip is to walk away from your desk for 5 minutes. Find a quiet place and just be.

    I struggle to take short breaks from my desk. I have no problem burning an hour at the gym, but taking 5 minutes mid morning or in the late afternoon is a struggle.

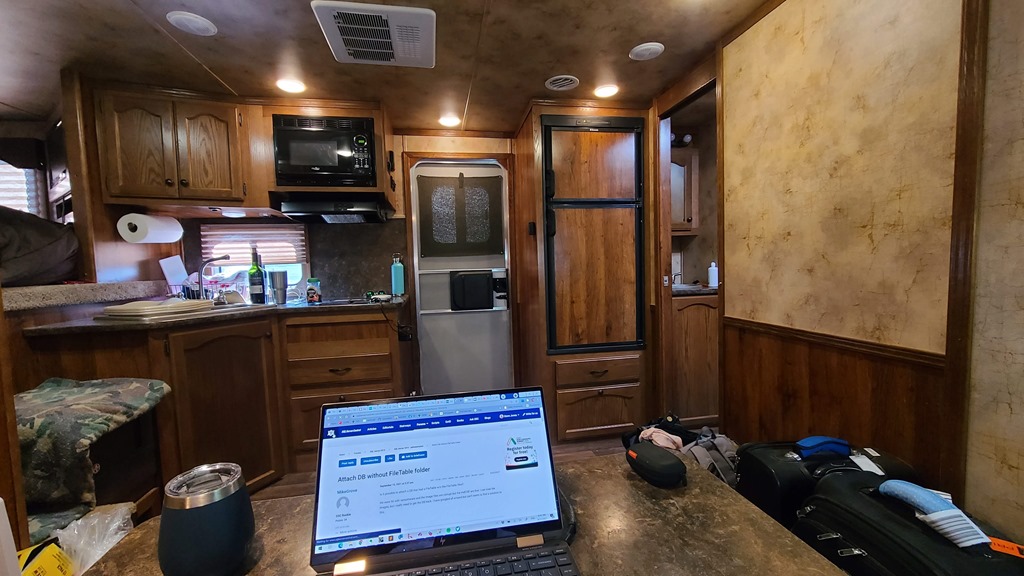
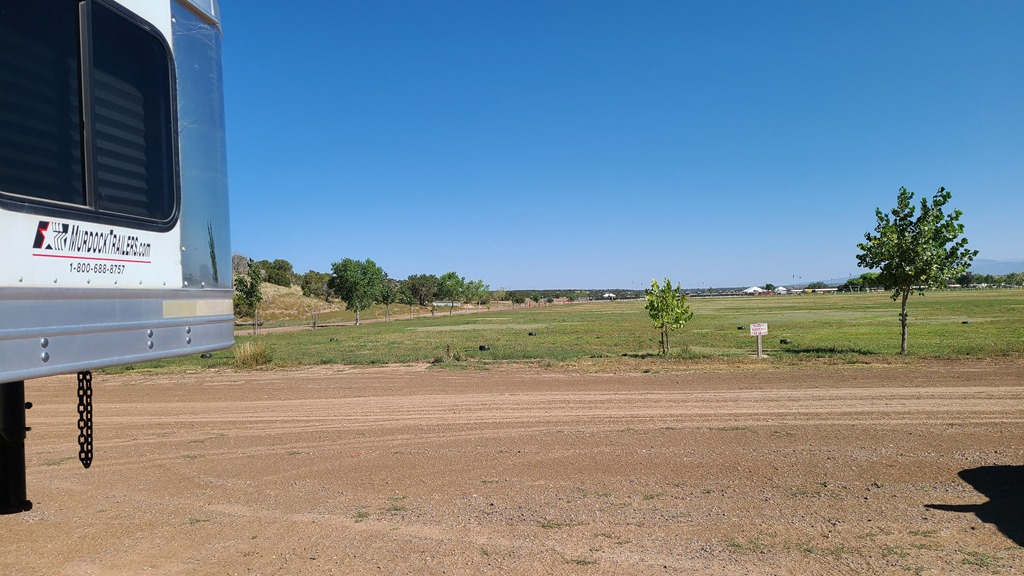
    As I wrote this, I was in Santa Fe with my wife, working in our horse trailer.

    20210917_093602

    I am taking some breaks to go film her competitions, but those are set events and it’s about a 5 minute walk, a 15-20 minute film, and then 5 minutes back. Good breaks, and I’m getting in some movement, but it’s not relaxing. I feel stressed to get back to work.

    However, I saw this tip and decided to try it. I got up, walked outside, and just looked around at the Santa Fe day. This is the view just outside the door.

    20210917_105837

    I decided to just come out a couple times today, stand here, enjoy the warm air, and just look around. No agenda, no purpose.

    It was a nice break. We’ll see if I can do this more when I get home.

  • Daily Coping 17 Aug 2021

    I started to add a daily coping tip to the SQLServerCentral newsletter and to the Community Circle, which is helping me deal with the issues in the world. I’m adding my responses for each day here. All my coping tips are under this tag. 

    Today’s tip is to share an encouraging news story to inspire others.

    The Olympics just ended, with some incredible performances from people all over the world. I love sports, and I’m awed and amazed by what some people can accomplish.

    Today, there are two interesting things related to sports. First, a story of trust, friendship, and bonding, as a blind man’s story is out in film. David Brown is a Paralympic champion, running the 100m in less than 11s. He does this with a partner, Jerome Avery, who is tethered to him. Truly an amazing partnership, and one that I hope people find inspiration from. Is there someone you can help in some way, perhaps in life or their career.

    Second, two athletes tangled up and fell during a track meet. Rather than get upset, they helped each other and finished together.

    It’s inspiring seeing stories of people coming together.

  • The PowerBI Volleyball Report – Organizing Data To Start

    One of my goals this year was to build a report that I can present to kids and parents showing the skills progression of their kids. I have attempted a few times to put something together in Excel, but it wasn’t easy for parents to visualize, and I wanted something better to let them focus on a specific kid, without making the data hard to consume. Power BI makes this easy.

    This post looks at my data capture process, and how I evolved it a bit to make this easy to handle in Power BI.

    Data Capture

    I’ve tried a few ways to gather data during matches, but paper turns out to be the easiest way to ensure this happens quickly and fairly accurately. While there are a number of apps, I find them problematic as one wrong press means the data capture stops, and I can then miss the next item.

    I used to calculate all totals by hand and then put them in a spreadsheet for parents after each competition, which worked well, but this format isn’t easy for Power BI to deal with.

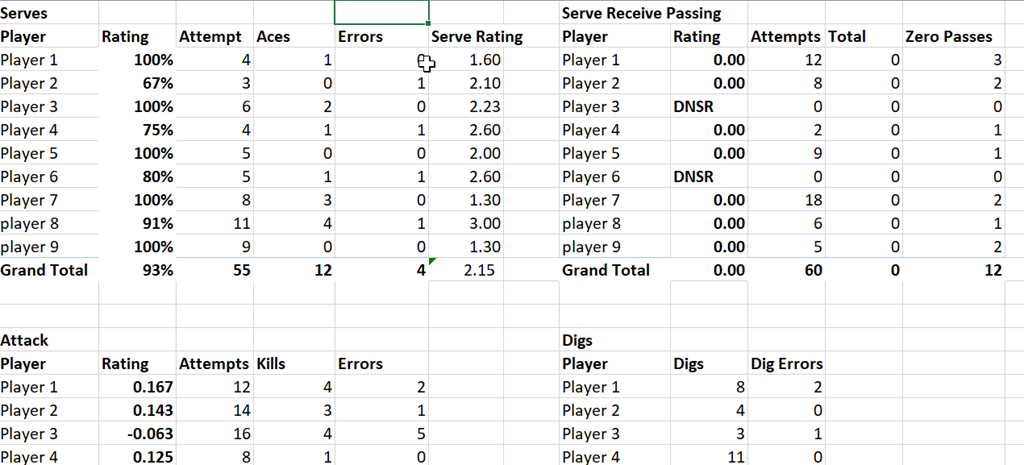
    2021-07-28 14_12_31-Stats2022_16Select.xlsx - Excel

    Easy for humans, but bad for reporting.

    As a result, I stopped to think what would be good and easy for Power BI. A table is best, and while I don’t want to bother with a database, I can modify my Excel formula easily enough to handle this.

    Since I will report on different areas, I decided to keep a master sheet for each report area. This means I have a “serve” worksheet, as well as others for Serve Receive, Attack, Digs, Blocks, and Assists. I can also add in new sheets as needed.

    Making a tabular format means that I added a few columns to this list. These columns are the slicers that atheletes and parents might want to use when they are reporting. In my case, these are:

    • date of event
    • event name
    • opponent
    • player

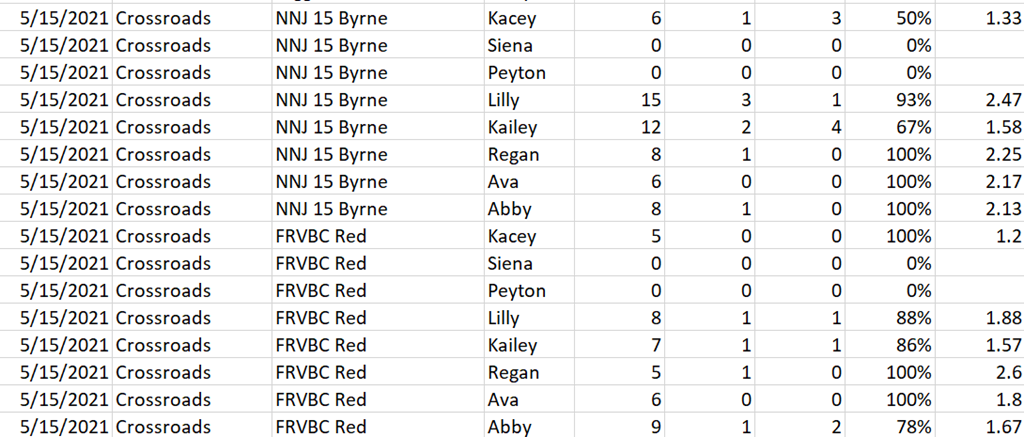
    With these columns, I can take my paper sheets, type in the raw data, and let Excel do a few calculations. This also means my main report is just a few sums from these raw sheets to get the totals above. From last season, I had data like this:

    2021-07-28 14_19_37-Stats2021_15Select.xlsx - Excel

    I also decided to enter data in the same order each time so that once I have a sum to copy data from this sheet for one player, I can copy/paste those formulas for the rest. This keeps the burden low for post game work.

    This also means that when I “Get Data” in Power BI, I just load data from each worksheet into a separate table in Power BI. This allows separate reports that are simpler to produce, as much of this data doesn’t make sense when combined together. This also means that I don’t have one huge table where I’m trying to manage data and potentially scrolling around a lot from left to right. This also means I can load this into SQL Server easily if I want to.

    This also means I need to set up incremental refresh in Power BI.