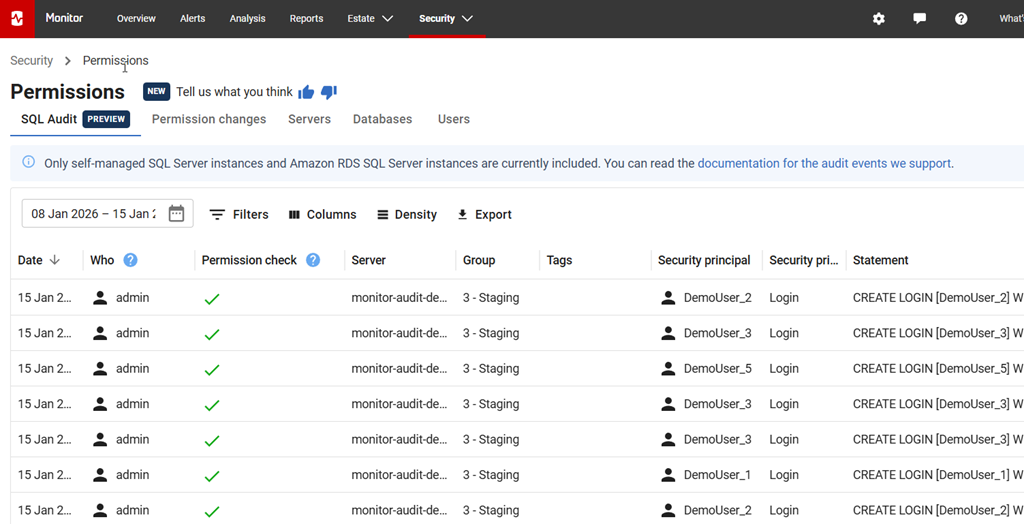
One of the features we advocates have been advocating for is a better way to track security changes in your SQL Server instances. The first slice of this work is in preview (as of 12 Jan 2026) and this post looks at what’s available.
The first iteration of tracking security changes queried instances and databases for information, stored it, and then compared it with other queries to determine what had changed. This was done hourly, and worked well, but it could not determine exactly when a change was made.
SQL Audit is made to capture this information in a lightweight way This works well, although the tooling (IMHO) is poor and hard to work with. Redgate Monitor is going to overlay this and make it easy for DBAs, InfoSec, and auditors to better understand what is happening in a SQL Server Environment.
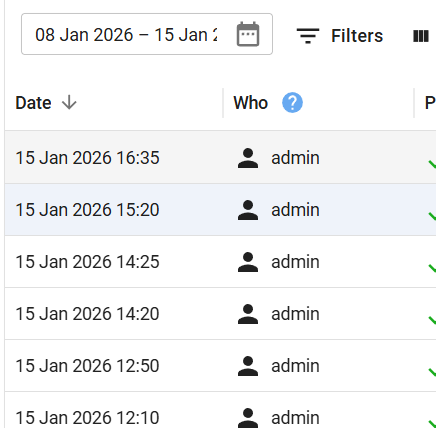
Each row in here gives the time of the change, as detected by SQL Audit. If I expand the first column, I can see the details. In this case, we have a regular workload running to change these so that the demo site has data, hence you are likely to see the same data every day on monitor.red-gate.com.
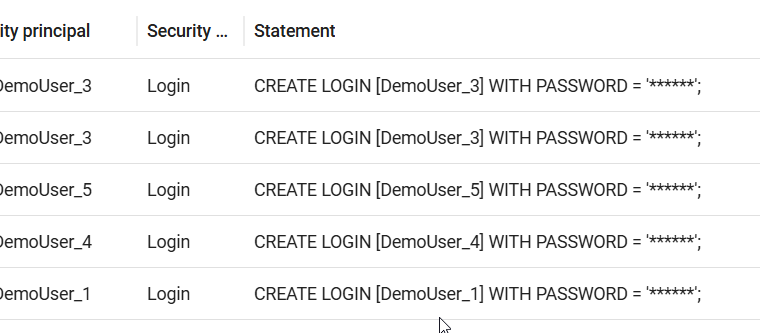
The last column in the right has the command captured, with PII redacted, as you can see here. The reason you may see only the CREATE LOGIN items and not DROP LOGIN is this first slice of work is just getting the additions, so you can catch those hackers trying to add accounts.
The SQL Audit documentation page explains how this works, and keep checking this as there is a team enhancing these features on a regular basis and adding more events.
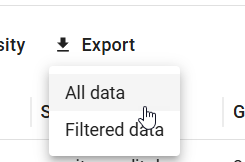
As with most of the pages in Redgate Monitor, you can filter and customize what data is displayed. You can also export your data as an csv file you can give to others. You have the option to get all data or just filtered data.
Summary
This post shows how a new preview feature in Redgate Monitor Enterprise uses SQL Audit to gather data on specific actions that are being taken on your SQL Server instances. This is a useful feature many customers have requested and it is being actively enhanced, so feedback is appreciated.
If you have feedback, please let us know as we value your opinions and comments on how we shape the future of Redgate Monitor.
Redgate Monitor is a world class monitoring solution for your database estate. Download a trial today and see how it can help you manage your estate more efficiently.
A customer was asking about what certain items in Redgate Monitor mean. They have a variety of skills on their staff, and they have developers accessing Redgate Monitor. This post explains how your staff can start to learn a bit more about SQL Server as they use the tool.
There are lots of little tips and documentation available in Redgate Monitor. These have been added with various references to help you learn more about the data collected by Redgate Monitor, as well as assist you in tuning your system for optimal performance.
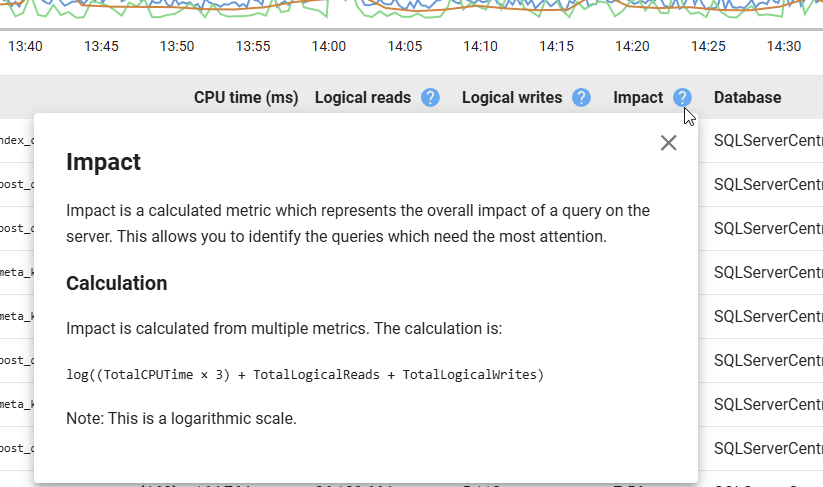
For example, there is an Impact column when I look at a server and see the queries that have run. Next to this is a question mark in a blue circle. Clicking this lets me learn about what this column is and how it is calculated.
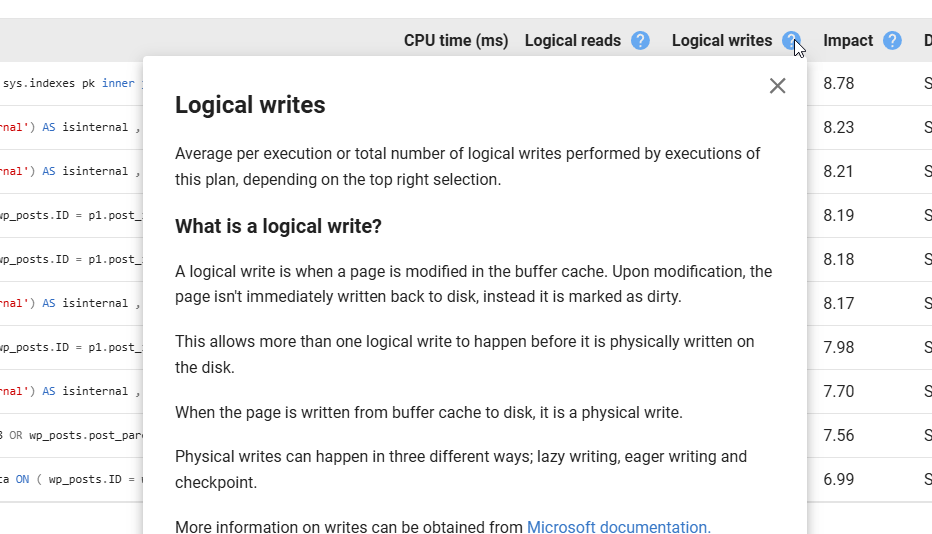
Similary, if I didn’t know what a Logical Write was, I can click this item and see where the data comes from. I also get a link to the Microsoft documentation at the bottom.
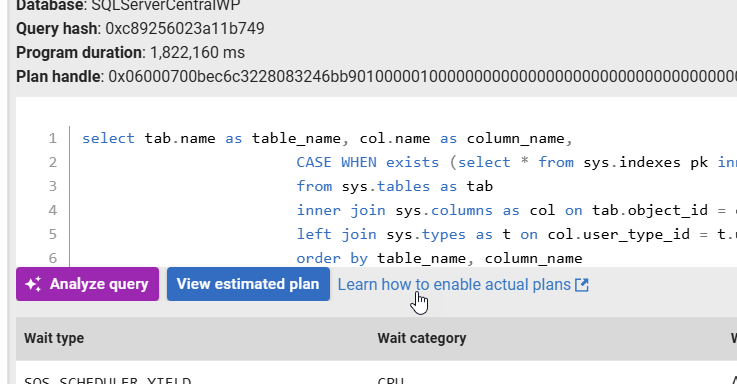
If I want to see actual plans rather than estimated ones, I have a link by the details of a query that sends me to the Redgate Monitor docs.
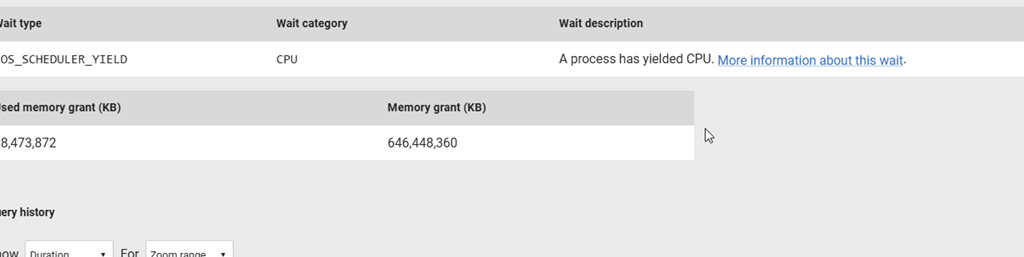
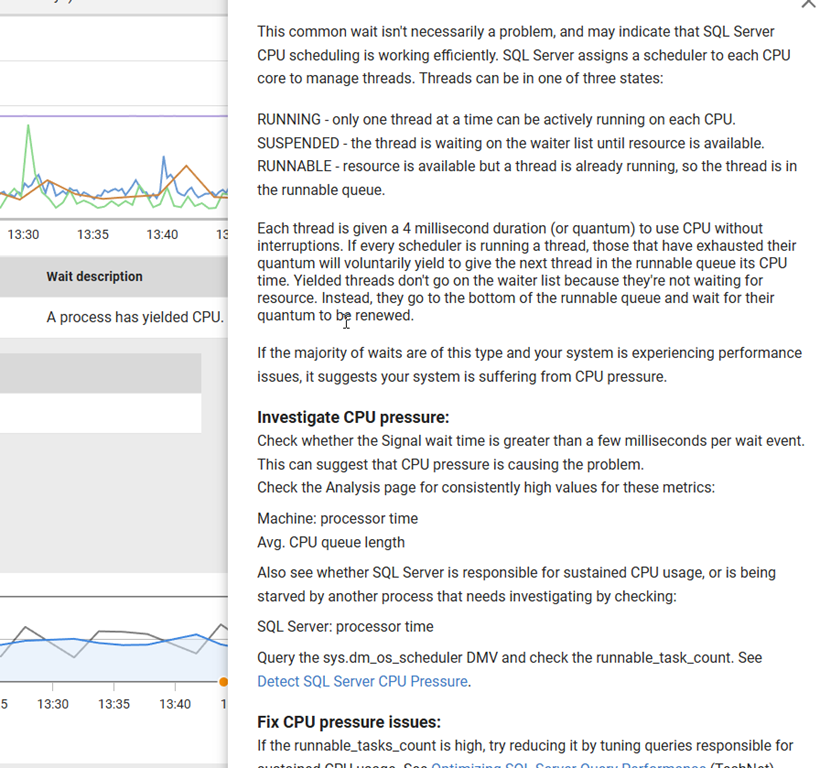
Below this I see waits that are significant. Next to the wait description, I can learn about what this wait means.
If I click this, I get a long description of what this is and where I might look to investigate this or fix it.
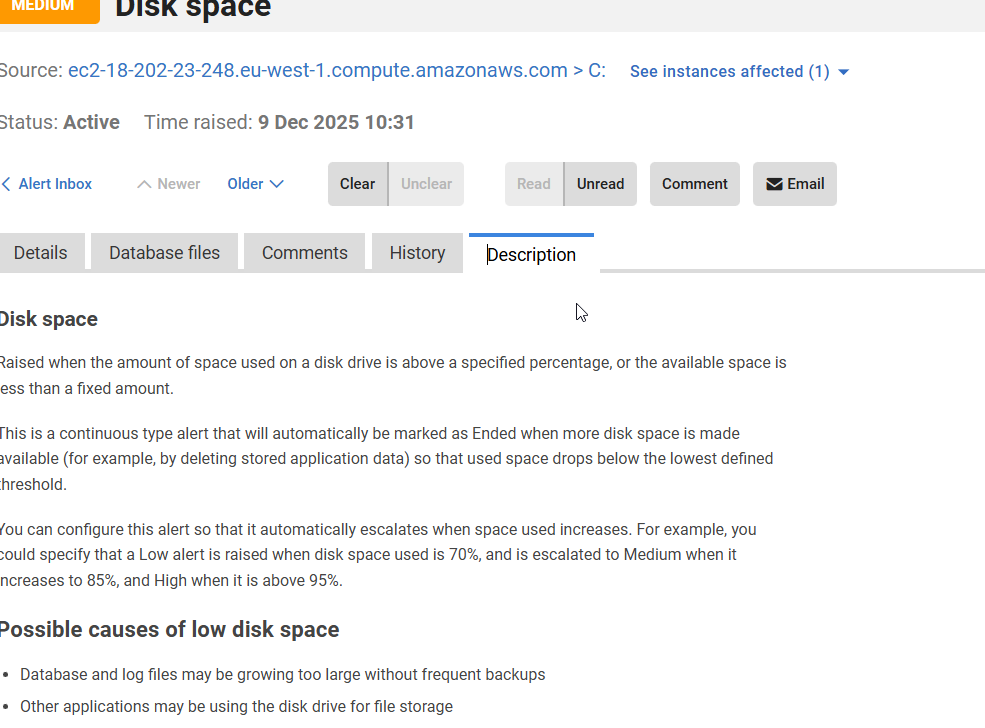
In the Alerts section, there is a description tab for each Alert. If you check this, it explains what this alert is, when it is raised, and potential reasons. Here is the Disk Space alert description
Here is the one for Job Failures.
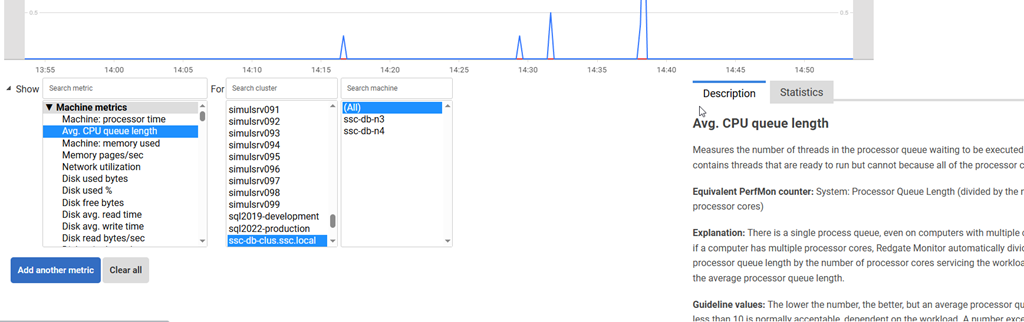
If you are analyzing metrics, we give more details when you select a metric in the Analysis tab. This is handy if here are metrics you don’t understand and want more information without spending time Googling or asking an AI.
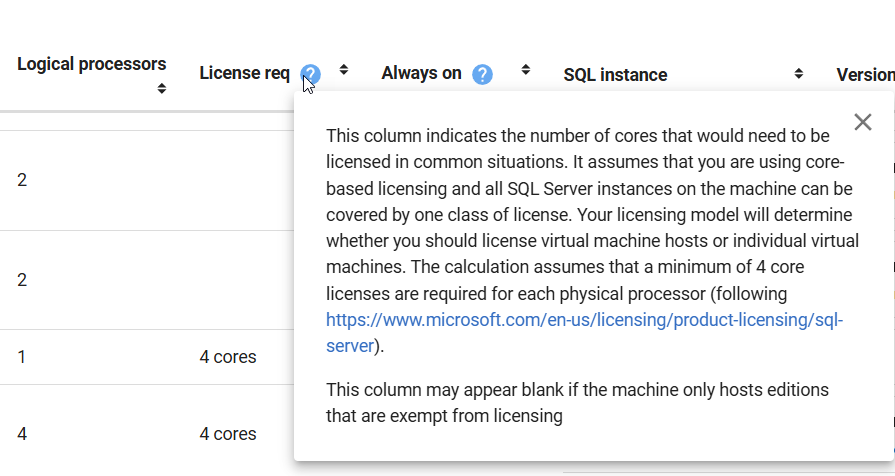
We even have some guidance in the Estate tabs, such as this tooltip on the License Req column. We let you know what we are showing and why, and a link to guidance from Microsoft.
Summary
This post shows some of the places where you can learn more about how Redgate Monitor works, or how you should use the data displayed. There are many more places inside the product where you get assistance that helps you get the most out of your monitoring solution.
SQL Server, PostgreSQL, Oracle, and other platforms have become very complex. Redgate Monitor tries to help simplify your workload by giving you a single pane of glass across the cloud, different platforms, and different environments, but it can be hard for anyone to manage an estate.
This post gives you an idea of how Redgate Monitor tries to help you learn, or reminds you, of what you’re seeing.
Redgate Monitor is a world class monitoring solution for your database estate. Download a trial today and see how it can help you manage your estate more efficiently.
A customer was asking about tracking logins and logouts in Redgate Monitor. We don’t do this natively, as this really needs an XEvent session. I decided to see if an AI could help me get a solution setup that might let me build a custom metric to track this.
I could do this myself, but it’s some looking syntax and capabilities, futzing with different code items, and trying to think about options. The goal here is can an AI help and save time. Not do the work for me, but assist.
So maybe not Vibe coding per se, but felt like I did little.
Note: This isn’t something I necessarily worry about. The rate might tell me if I’m under attack, but I’d hope applications would detect this first (and be able to block things)
The Problem
The customer just asked if they could track logins and logouts. I mentioned the Server Properties (shown below), to see what they’d done. They hadn’t used this, but also, it’s not very flexible or reportable as it puts info in the error log.
Tracking this info really requires an XE (Extended Events) session. That’s a lightweight way to capture this information. If I want to capture some info about the client logging in, or failing to log in, that’s the way.
A separate request was could we also get logouts. The only way to do this is with an XE session and the sqlserver.logout event.
With that in mind, let’s see how my assistant can help.
Using Claude
I opened Claude and asked this: “in sql server can I track login counts and logout counts from t-sql?” and actually spelled everything correctly. No savings here.
The base answer I got started like this, giving me a few options.
The ending asked me if I’d like to get the Extended Event option. It had provided only the login trigger option. I need an assistant, so I said yes.
That first answer was maybe 20-30 sec, but I started reading things, so this felt like a discussion with another DBA. Once this started, I let it go and it started to write out and work on code on the right, and then fill in the results on the left. This was a few minutes, so I flipped over to answer a few emails while I saw this on another monitor.
The results started with a table to store data and then an XE session. The whole page looks like this, which is a lot.
Here’s the full left side. Notice that it asks me for a next step. I’ve met a lot of junior DBAs, or even Senior-DBAs-with-1-year-of-experience-10-times that didn’t do this.
The actual code doesn’t matter yet, since I realized this isn’t getting failed logins. I asked another question and got a response. A polite Claude complements me and then rewrites code. This took another few minutes, and it was neat to see it rewriting its code on the right, adding in a new field in the table and adjusting the session.
I watched a bit, but got distracted with a Slack message. One nice thing is I can move on to another task while my assistant keeps working.
At the bottom, I liked the summary of how it works.
My Slack message was from an AE, asking a question about the server property stuff (from the customer). I could have typed a bunch, but when I looked back, Claude was finished, so I asked it.
I copy/pasted this to the AE, as it’s a good summary for the customer. This assistant is making my job easier.
Testing the Solution
I didn’t just send this. Instead I decided to test this on a few local systems. I keep a DBA database on each instance, so I ran the code in there to create the table and session. As a precaution, since this isn’t my code, I ran each item separately.
The table worked here. I had another window for the session, which I looked over, but didn’t extensively check. I’m not an XE expert, and I’d likely fumble this code worse than an AI at first, so I checked the events and actions. I decided to just run this since it looked good.
When it came to the procedure, I got an error. I copied and pasted this into Claude. It recognized an issue and fixed it. This took a few minutes, but this is faster than I could have corrected my own amateurly written query against XE.
Now I had a procedure. One thing I edited in both the session and proc is that I removed the hard coded c:\SQLData path. I wanted this captured with my other instance stuff in the \logs folder, so I left just the name of the XE session.
Adding Archival
One of the things that Redgate Monitor does really well is manage older data. I’ve seen so many people, including myself, set up something like this and then a year later realize they’ve captured GB of data.
I asked Claude to just fix this for me.
I grabbed the second command for my Agent Job and changed 180 to 90.
SQL Agent Job
Claude again asked me above about jobs, but jobs are simple and easy, and I wanted to think about it for a minute. I right clicked and created a new job. I thought about the name and description I wanted. Then I made two steps, pasting in two exec proc commands for the procs my assistant had written.
The last thing was some testing. I ran my job to be sure it was working. It completed, which was good.
I made a few logins and logouts, including a few failed logins. Then I queried my table. I didn’t remember the name, but my assistant tends to pick plain/boring names. So I used SQL Prompt to find it with a ssf <tab> l and got this:
When I got a query and checked, I see logs of my logins and logouts.
Redgate Monitor Custom Metric
My AE and customer wanted to see this in Redgate Monitor, so I decided to ask Claude. It was happy to help.
I could repeat that for the other items (failed logins and logouts). I didn’t, but this gets me ready to add this to Redgate Monitor.
Summary
This shows how an AI assistant can help me set up some auditing for security purposes. There is nothing complex here, and I’ve set up a bunch of this myself in the past. I even have a blog on this.
However, the code is cumbersome and slow to write for me. Or most humans unless you end up working with XE every day. Even if you use SSMS and the GUI to generate the script, it can be slow. I know I’d certainly have to look things up. In less than 15 minutes, I had a fairly well working solution, with archiving (deleting) old data and I didn’t need to focus tightly the entire time or type a lot. I did some other work, and I could focus on just testing.
Claude was a great AI assistant to this problem, which is similar to a lot of DBA-type work I’ve done in the past.
I tried Google Gemini and ChatGPT. A quick summary of those, which didn’t work as well. At least not to me.
Note that I use the free versions for all of these tools right now.
Gemini
The first prompt got me just a table and trigger, with a followup if I wanted more. I asked about XE and got a basic session, not as easy to read as Claude and embedded inside the response. It also had fewer actions.
I got to the same place, but it was more prompts and I had to keep guiding it along, like micro, or at least mini, managing another DBA. On the plus side, this was faster.
ChatGPT
ChatGPT suggested a trigger, but noted this wasn’t great. It did suggest extended events, and a complete solution. I could have just entered “yes”, but I didn’t. I’m still working on muscle memory at times.
I got each part of the solution separate, but this has me scrolling through explanation and code. Again, I prefer the Claude side-by-side approach, but this works. And it’s fast.
This also kept leading me along the process, which I liked. It certainly likes the checkboxes and Xs in its results.
Both tools helped me with custom metrics.
Video Walkthrough
Here is a a retry, and then showing the first solution. I think Claude learned a bit the second time.
The monitoring capabilities in Redgate Monitor were originally fairly limited to a few counters from PerfMon. A few people had written custom metrics on sqlmonitormetrics.com that clients could use, but we’ve had customers asking for more native integrations.
We’ve done it. With version 14.2, we have added an estate view of your replication environment. In the Estate menu, there is a new entry for Replication Monitoring.
If I click this, I get a list of the jobs running replication across various servers. You can see this below, with each instance and the job denoted by a REPL- at the start. These are the defaults that Microsoft sets up and should be left alone.
You can see below that the agent server name is listed, and I can click it to get to that server overview in Redgate Monitor. I also have the category and job name to the side. Beyond that we have the last completed run if it’s successful. If it’s running, the Job Ended is blank. To the right we have the publisher, subscriber, and distributor names.
I can resort the columns, such as below when I am looking by category.
I can also sort by publisher:
Or subscriber (or any other column).
Clicking the column a second time reverses the sort order.
Alerting
There are two new replication specific alerts available for the job failures and maintenance job failures. These work the same as any other alert in Redgate Monitor and can be configured for specific servers, groups, levels, etc., with notifications going out to all the notification targets.
Here are the alerts in the alert configuration.
These jobs run across the various replication categories: distribution, merge, snapshot, log reader, and queue reader.
If I look at the details, I can see the job failure works across multiple categories and is set to a high level alert. I can adjust this as I can with any other Redgate Monitor alerts, and exclude jobs if I wish with a regular expression.
Replication isn’t something most people use, but for those that do implement it, monitoring is critical. Redgate Monitor has added some native capabilities to let you get a glimpse of your entire replication estate at once and get notified if there are issues.
Replication can be amazing, but I find it brittle. When it works, it’s amazing, but when it breaks, it’s broken. Getting a jump on issues is important for many organizations and Redgate Monitor can help you do that.
Redgate Monitor is a world class monitoring solution for your database estate. Download a trial today and see how it can help you manage your estate more efficiently.