Tag: Redgate Monitor

  • Monday Monitor Tips: The MCP Server

    I have been experimenting with MCP servers in a few ways, and pressing on our Redgate Monitor team to add one to their system. They did, started adding tools, and are continuing to work. I’m excited.

    Here’s a quick look at the MCP server for Redgate Monitor (preview in July 2026).

    This is part of a series of posts on Redgate Monitor. Click to see the other posts.

    Getting Started

    I’m not going to bore you with the setup and configuration. You do need to be on a 14.23 or later as the version. Your account rep can get you setup instructions, which are still be worked on and finalized. This is really a work in progress as of this writing (Jul 30) and I’ve found a few things that didn’t quite make sense, so be patient. This is editing the Monitor Webserver config file and enabling this.

    Once that’s done, it’s a little tricky with an AI agent system. This is the high level, and I’ll do some more detailed notes about getting this in VSCode and Claude, where I work. The basic steps are:

    • Enable in Redgate Monitor
    • Create an MCP Access token
    • Add the MCP config to your Agent setup

    It’s not quite as simple as it sounded to me, but it wasn’t that hard. It’s mostly working through some of the steps and ensuring you get your JSON correct.

    Accessing the MCP Server

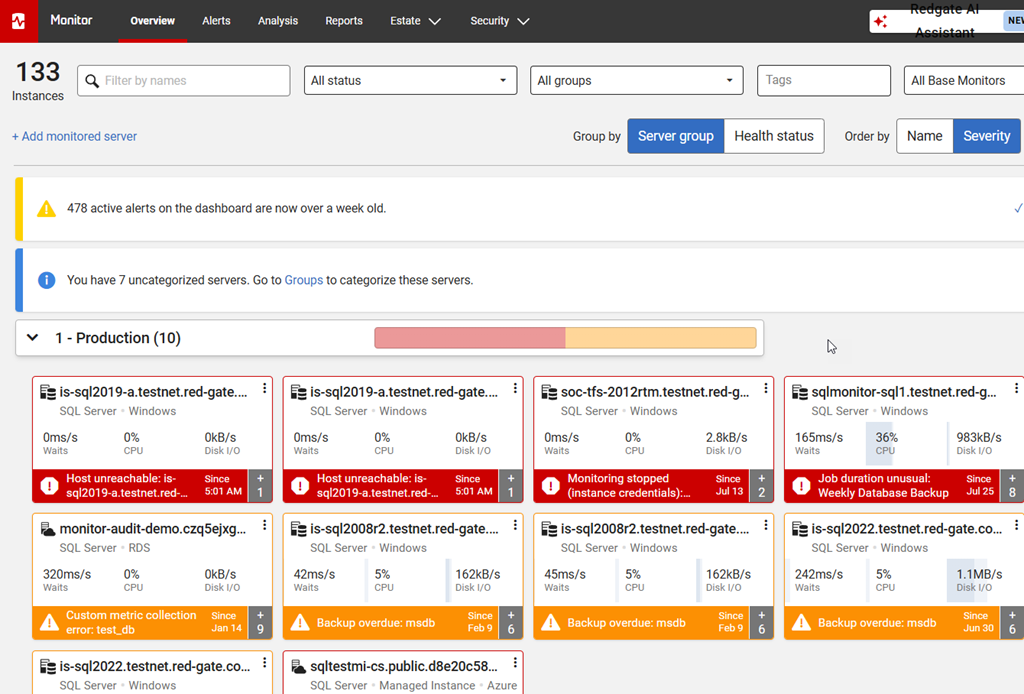
    I connected with Claude for the demo in the Video Walkthrough below, but I’ll give you a quick look here. I set my token for the prod/staging/dev systems. When I look at the test instance of Redgate Monitor, I see this: lots of servers and alerts.

    2026-07_0120

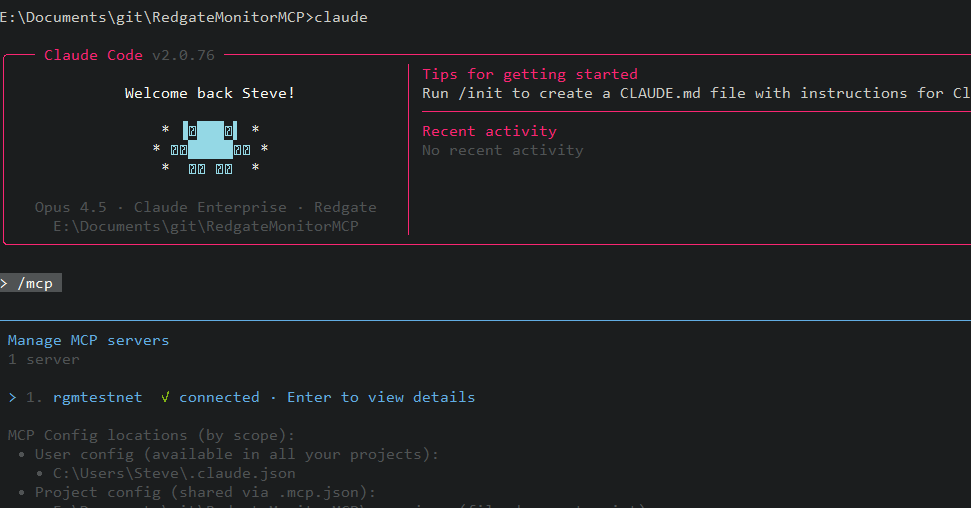
    Once the MCP server is added, I start Claude and run a /mcp. I see my server get connected.

    2026-07_0121

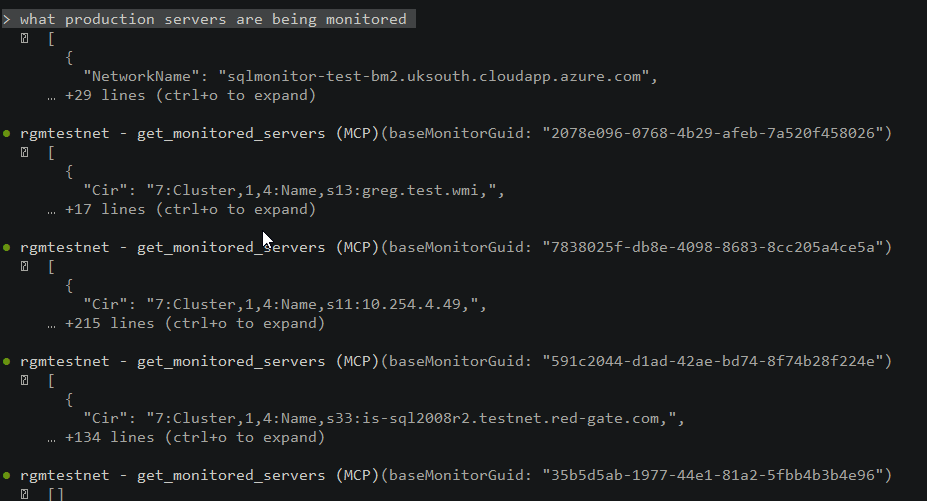
    There are a number of tools, which have grown since I started testing. I don’t have a complete list and anything I put here will be out of date in a week, so I won’t bother. In any case, I’ll ask for the production servers. I can see the various base monitors being queried. This is slower than almost any customer, since we have more BMs than most people here. Most have 1-2 at most.

    2026-07_0122

    Note: I did get asked for permission a few times before the tools were accessed. Since all MCP stuff is read-only now, I just granted permission for all sessions.

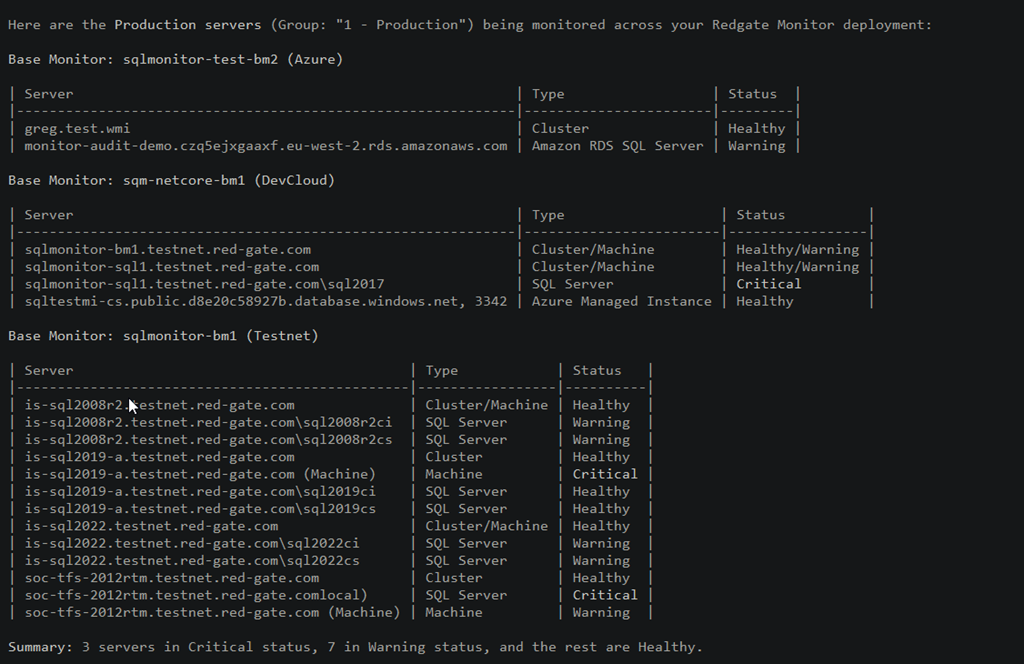
    Here are the results. Note the summary at the bottom.

    2026-07_0123

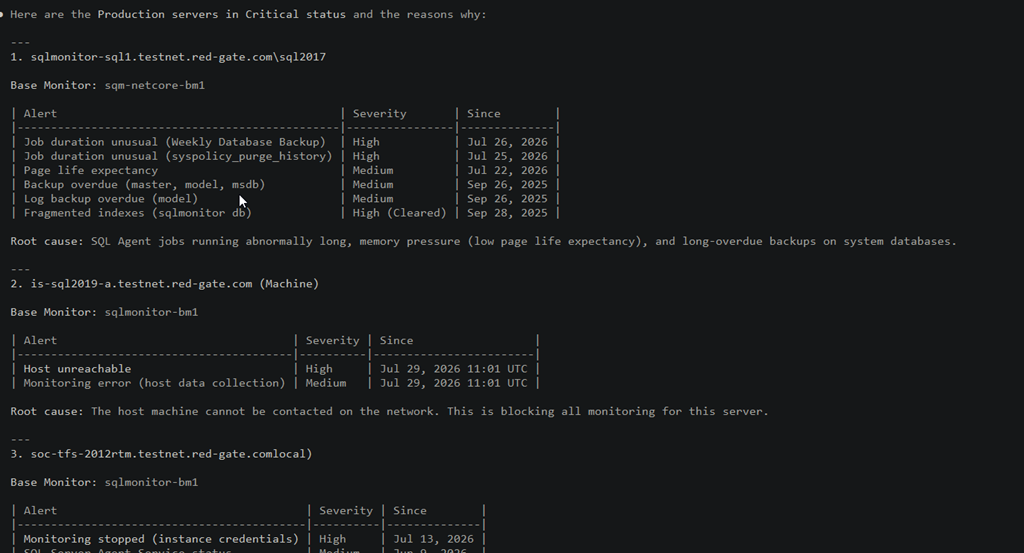
    I next asked this: which servers are in critical status and why. The Claude LLM interprets this and starts querying the Redgate Monitor server, using the token for security, and the tools, which are really the API of things that can be run.

    The results I got were what you see below. The LLM had to run a bunch of queries to get results and the read in those results and interpret them. In this case, there were a lot of different queries of tools to look for data. This probably took a minute or two, but it feels long while watching the screen.

    2026-07_0124

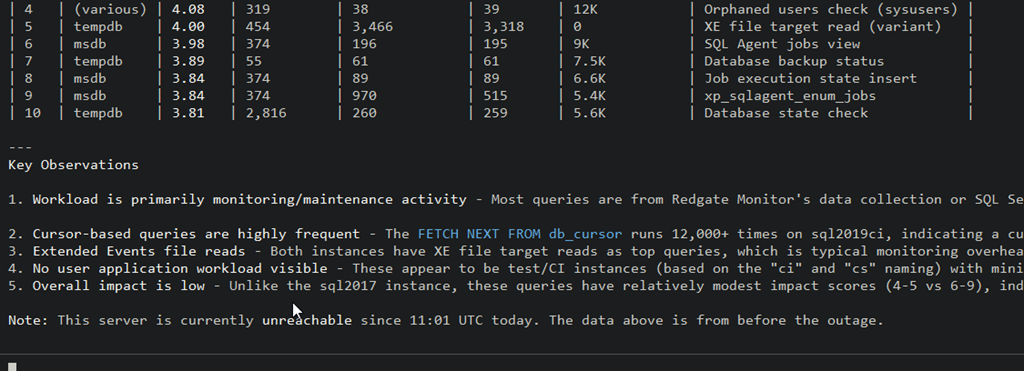
    I next asked about queries on an instance. I don’t know these servers that well, but I know there are workloads on some to simulate what clients see. I decided to ask about one of the 2019 instances in production. In this case, I got asked for permission for a new tool (I hadn’t run the top queries tool) and then the agent went to work. You can see the tool usage and results. In this case, the system was down when I ran this, and it let me know this was from before the outage.

    2026-07_0126

    At the bottom, there are some observations, which can be useful. I’ve got cursors running, XEvents, etc. Helpful to look at this for a system I don’t spend a lot of time examining.

    2026-07_0127

    Ultimately the MCP server is a way for you to use tools you use already, but allow them to query the data in Redgate Monitor.

    I’m excited to see where this can go, and how it can help customers interpret all the data collected by Redgate Monitor and more easily summarize it. This will be useful to some, though others of you might not like MCP access and instead stick with the internal AI tools.

    It’s up to you, but we are giving you the choice to work as you wish.

    Summary

    The Redgate Monitor MCP server is in preview as of July 2026. I tried to give you a short sense of how you can use this to query Redgate Monitor and keep an eye on your systems. There are lots of ways to work, and I’ll try to give some guidance on specific things over time, but for now this gives you a sense of how MCP works.

    I’ll do future posts that cover the config and help you get testing in your own environment.

    Redgate Monitor continues to grow and advance and MCP capabilities are a great way to start using AI to help manage a large database estate, with your own AI resources.

    Redgate Monitor is a world-class monitoring solution for your database estate. Download a trial today and see how it can help you manage your estate more efficiently.
    Video Walkthrough

    Watch me use the MCP server live.

  • Monday Monitor Tips: Virtual Machine Usage and Cost

    One of the things I’ve been requesting for a number of years is cost information. I could see this coming in 2015 with the move to the cloud and need to justify the resources provisioned along with sizes. Doing that effectively needs cost information.

    Redgate Monitor has added a bit of cost information, and the virtual machine section in the Estate tab contains this. This post looks at what is available (as of June 2026).

    This is part of a series of posts on Redgate Monitor. Click to see the other posts.

    Virtual Machines

    When I first started managing VMs and moving database loads to them, one of the things that I was concerned about was the CPU and RAM usage. CFOs and lots of admins wanted these are 100% to get the most out of their investments.

    I wanted something less to prevent my phone from ringing constantly.

    When you pick select the Estate tab, you see a number of items, but since v143.0.2906, there is a Virtual Machines item.

    2026-06_0181

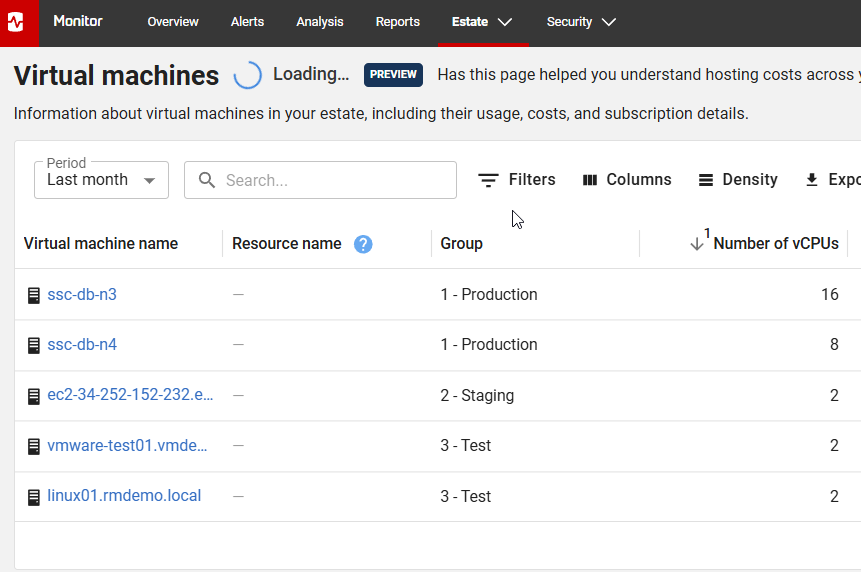
    If you select that, then you see all your virtual machines, along with the resource name, group, and various metrics. This is a quick overview of what’s running.

    2026-06_0182

    If you look at the list, some are local and some are in the cloud. In addition, to the right, I see the metrics that help me understand average usage in a few ways: CPU, memory, storage allocated and used, and costs.

    2026-06_0183

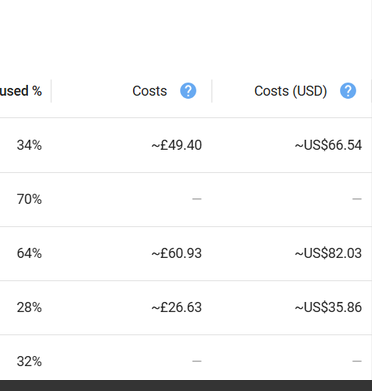
    There aren’t any costs above as we filter that on the demo site, but if you provide cloud credentials, we use this to get some cost information. Here’s a shot from the doc site, which shows the costs in local currency (pounds Sterling for RG) and USD, which helps normalize the costs. You can read more about this on the doc page.

    2026-06_0186

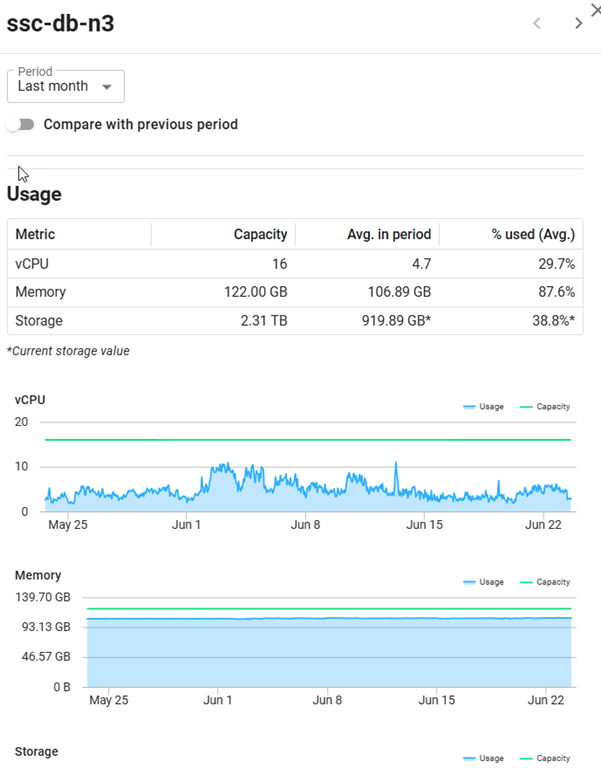
    If you select a machine, a blade slides out with more details on usage. Here you can see the primary SSC server. This helps me decide if this is over or under provisioned based on data. I see CPU usage across a month, along with memory and storage (not shown).

    2026-06_0184

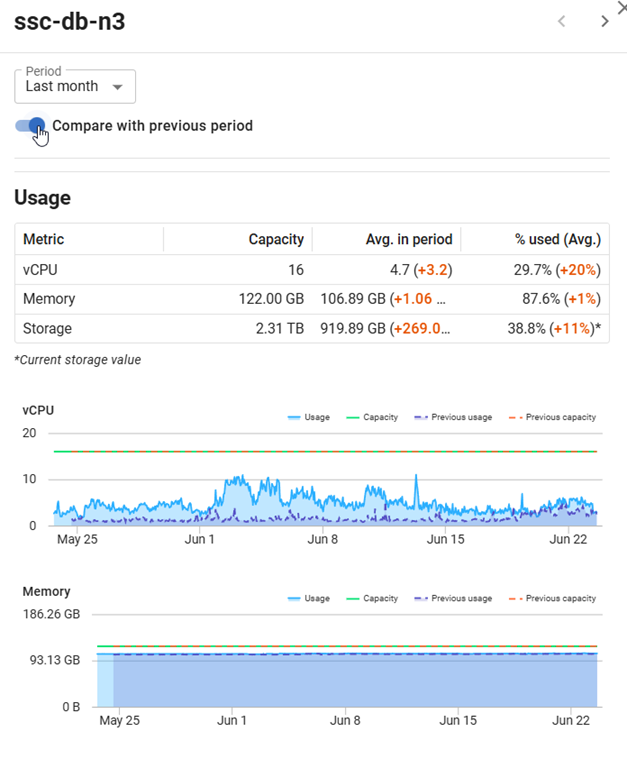
    If I click the “compare with” toggle, I see the last two months overlaid, which is useful info. This helps me decide if last month was normal or an outlier. It does seem like June was a busier month than May, which is good. My boss likes busier.

    2026-06_0185

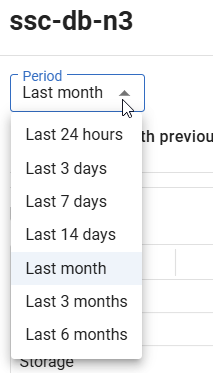
    As far as data, I have choices for the period, going from the last day to 6 months.

    2026-06_0187 

    It’s up to me to keep this data, and I have an entry as well in the Data Retention settings for this data.

    2026-06_0188

    There’s more coming, and I know there are plans to add PaaS data as well, but if there are things you’re interested in, please contact your account rep and let them know what needs you have and why. I think this is an important aspect of monitoring that will grow over time.

    Summary

    This post showed the first slice of work on costing information, with an emphasis on virtual machines. There is performance as well as cost data, so you can evaluate whether you are appropriately sized for your systems.

    I’m looking forward to more information, including custom costs being added for on-premises machines, as well as PaaS services.

    Redgate Monitor is a world-class monitoring solution for your database estate. Download a trial today and see how it can help you manage your estate more efficiently.
  • Monday Monitor Tips: AI Alert Analysis

    We keep adding new AI capabilities to Redgate Monitor, where it makes sense. Check out this new feature we’ve added for alerts. This is a great addition to help a busy Ops staff cope with a large database estate.

    This is part of a series of posts on Redgate Monitor. Click to see the other posts.

    Alert Index Analysis

    One of the new things we’ve added in Redgate Monitor is an AI analysis of your alerts. This isn’t for every alert. Right now, we have three where this works in preview:

    • Long-running query
    • blocking process
    • Deadlock

    This is documented on its own page.

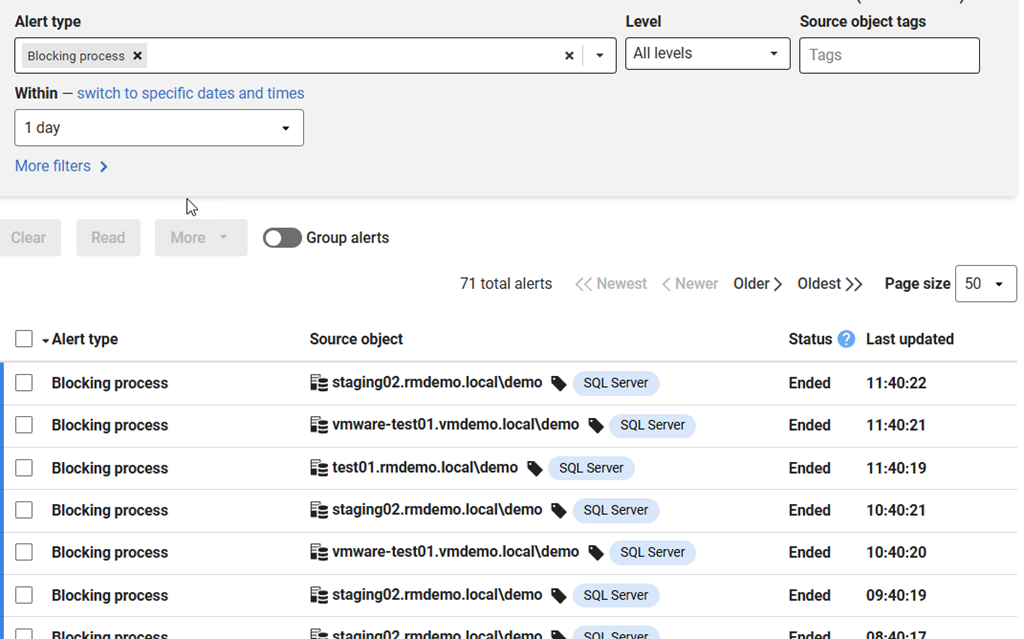
    You can see this if you go to the Alerts page and look for a blocking process alert. Here’s a URL, but this repeats regularly, so just find the alert. You should see something like this:

    2026-06_0115

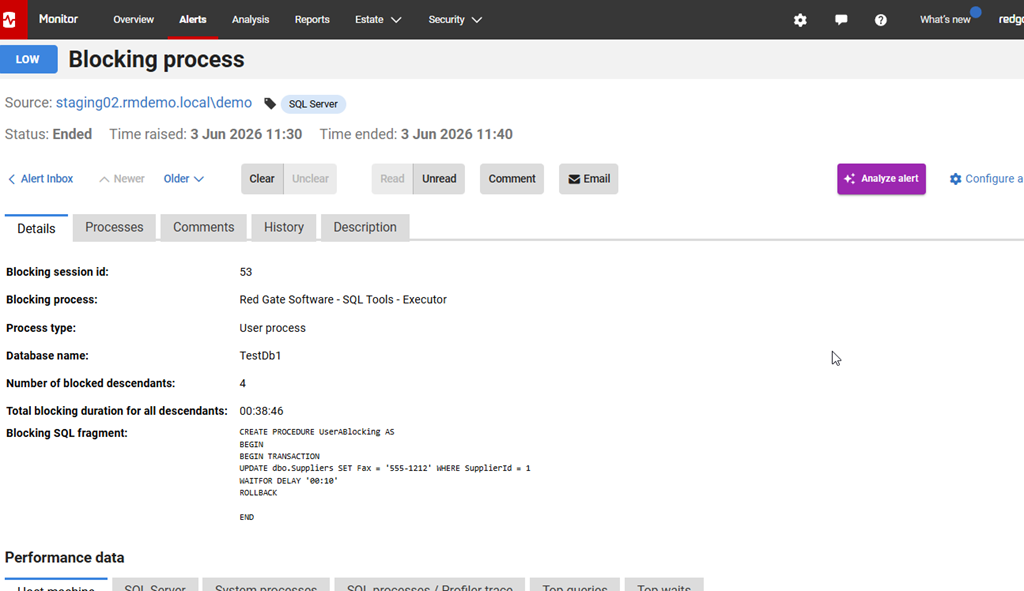
    If you click on the alert, then you’ll see the details, as shown here. However, to the right is an “AI Analyze Alert” button.

    2026-06_0116

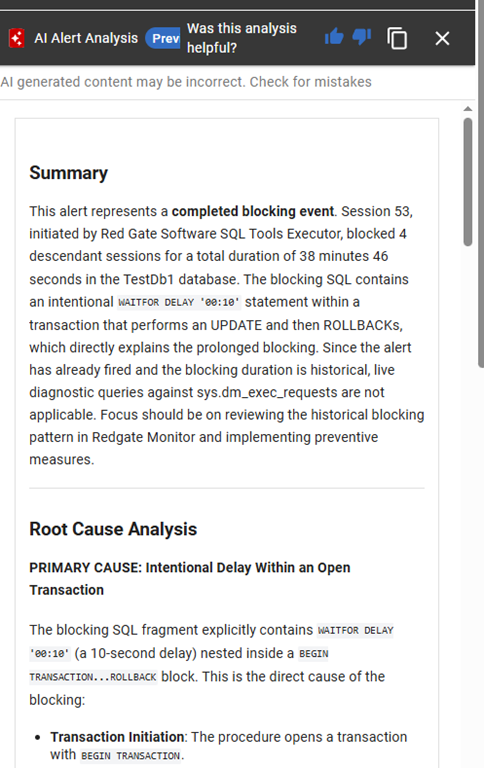
    If you click that, a blade slides out from the right, and it has some analysis in it. This has a summary at the top. For my session, this had ended, so the summary is nice in that it gives me an overview with the time of the blocking and the statement. There is also a root cause analysis below this. This is something that would help me quickly answer questions from my boss.

    2026-06_0117

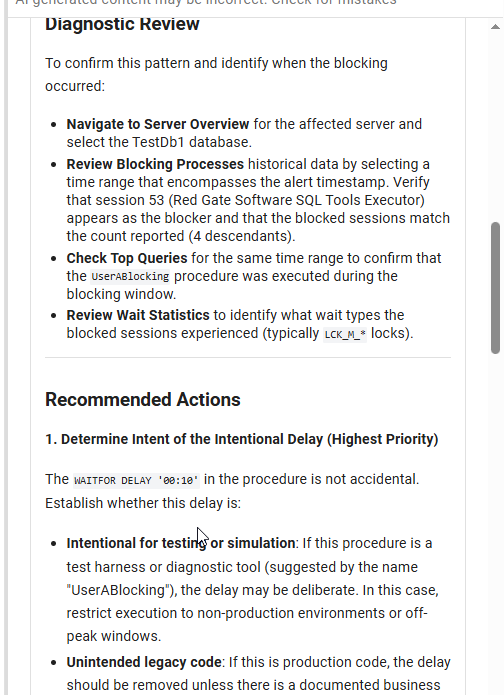
    Further down there is a diagnostic review, which helps you navigate Redgate Monitor to verify things. You should use the AI to help you and still verify what it says. This is a good explanation, but worth double checking. There are also recommended actions below this.

    2026-06_0118

    It’s a good way to approach a series of alerts, especially in a busy environment where you might have lots of these alerts across different systems.

    Summary

    AI is a great tool in places, and this is one of those measured approaches from Redgate to use AI where it’s helpful and useful, and does some work for you. Looking across a bunch of similar data and getting patterns, getting some quick insight into timings, that’s useful. This might be especially great when someone calls you with a question and you need a summary.

    As always, you should verify the diagnosis and recommendations before you do something, but this does give you a quick place to start fixing chronic issues in your system. I look forward to AI analysis coming to other alerts.

    Redgate Monitor is a world-class monitoring solution for your database estate. Download a trial today and see how it can help you manage your estate more efficiently.
  • Monday Monitor Tips: Oracle Custom Metrics

    One of the popular features of Redgate Monitor has been the ability to add custom mertics for various purposes. This has been popular, and along with our curated list at sqlmonitormetrics.com, it’s a feature that’s used by many.

    It has been a SQL Server only function for awhile, but customers have requested other platforms. We’ve added the capability for Oracle and PostgreSQL.

    This is part of a series of posts on Redgate Monitor. Click to see the other posts.

    Adding Custom Metrics

    You can see on my custom metric config page that I have a few business metrics added. I recommend these to customers as often a business metric catches an issue before it appears in Perfmon type data. Let’s add a new metric. I’ll click the

    2026-04_0236

    I’ll click the “Add a custom metric on the right side” and will get a new form.

    2026-04_0237

    This form used to be mostly the same, but the “Choose where to collect data from” didn’t have a drop down. It only had the 1. Select instances and the 2. Select databases (to the right). This new drop down is where you pick the platform.

    2026-04_0238

    If I click the drop down, I see three choices: SQL Server, Oracle, and PostgreSQL.

    2026-04_0239

    I can select Oracle and my select database section disappears. This is because an instance and a database are the same thing in Oracle.

    2026-04_0242

    If I select PostgreSQL, I can still select databases.

    2026-04_0240

    The rest of the form works the same way. When I’ve selected Oracle, I get a default query listed that lets me know the structure of my result set. I need to return an integer with the con_id, a metric value that is a scalar and an optional string with details.

    From there things work as they do with other metrics.

    Summary

    This post shows a new capability in Redgate Monitor for Oracle, where you can track your own data, as you see fit, and then let Redgate Monitor alert on changes, graph this over time, and help you better understand your system.

    We are enhancing and adding to Redgate Monitor every week, but there are always more things that many of you want, and custom metrics give you the ability to choose what you want to monitor.

    Redgate Monitor is a world class monitoring solution for your database estate. Download a trial today and see how it can help you manage your estate more efficiently.