Tag: syndicated

  • Stacked Bar Charts vs. Line Graphs–Which is Better?

    I ran across an interesting post from Rita Fainshtein that looked at the different types of graphs for a set of data. I thought that was interesting, so I ran my own experiment. I found for my data, a line graph was better, but let me know what you think.

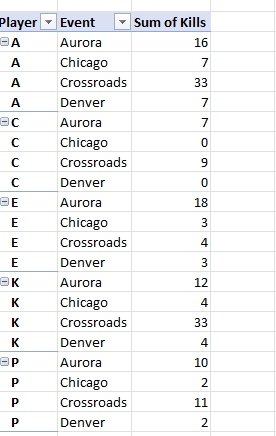
    My data set was simple, a few players across a few events and their number of kills. I coach volleyball and I’m always trying to present stats in a useful way. Here was the small set I picked.
    2023-05-04 15_26_09-Kills.xlsx - Excel

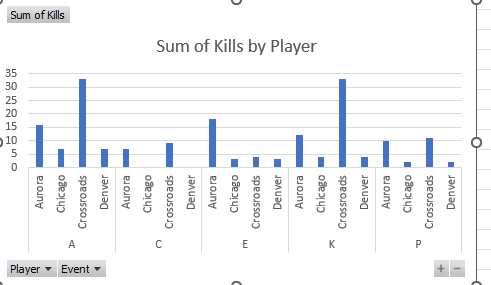
    Nothing fancy, but this is similar to what was in the article. From here, I asked EXcel to insert a chart from the Recommended Charts and picked the first one. This is what I saw:
    2023-05-04 15_17_10-Kills.xlsx - Excel

    This isn’t bad, though it’s hard to compare across events. I see how A did for all these events, but if I want to see if she was better or worse than K, I’m guessing on some of the lines.

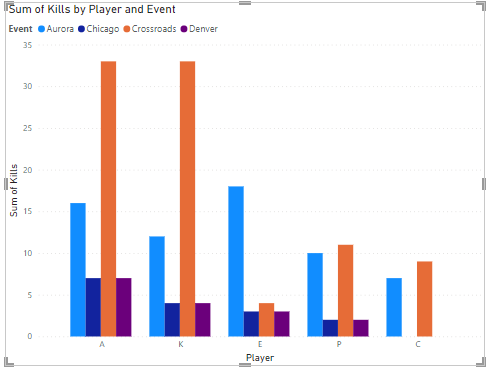
    Next, I opened Power BI. I added my data set and then dragged a value to the visualizations. The default chart I got was similar to Excel. Not a great visual. It’s Ok, but suffers from similar problems.
    2023-05-04 14_05_01-Untitled - Power BI Desktop

    I moved the player and the event from the axis to the legend, because that’s more appropriate for this dataset.

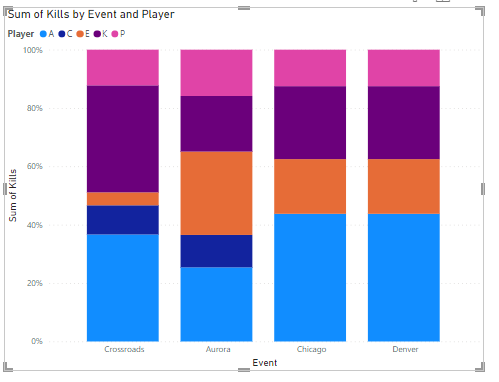
    I changed the type to the first stacked chart I saw, and got this, which I think isn’t useful at all. There isn’t a way to measure 100% in this case, so normalizing all data in this way is very unhelpful.
    2023-05-04 14_06_13-Untitled - Power BI Desktop

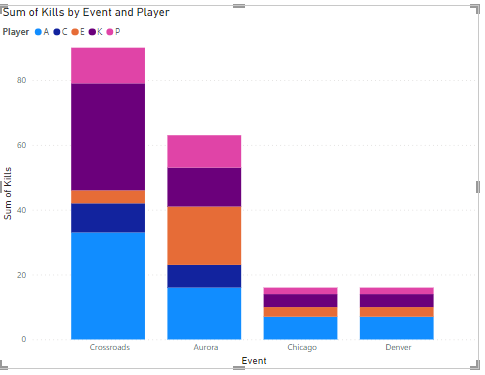
    I switched to a normal stacked chart, which is OK, but for Crossroads, is A or K better? Does E outperform A in Aurora? Very hard to tell.
    2023-05-04 14_06_18-Untitled - Power BI Desktop

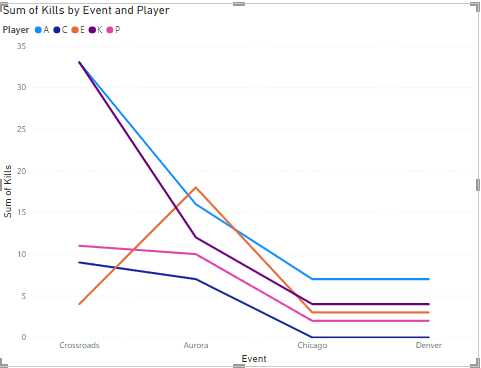
    Next I tried a line chart. This I think is the best for my analysis. I can see the events across the bottom and the colors for the players make it easy for me to compare them with each other. I am not color blind, so this works for me.

    I can also compare the players individually across events by following the lines. I can see them all trending in similar ways, which is expected. If the team does well, everyone does better. If not, then not. I also see the outlier where E outperformed A.
    2023-05-04 14_05_45-Untitled - Power BI Desktop

    Summary

    The line graph worked best for me. However, the data I am looking at lends itself to a comparison that looks good here. The stacked bar chart isn’t as clean when drawing conclusions, but that’s because I’m looking at the different segments across items, not necessarily with segments for the same item. Of course, I think that would be hard as well.

    Ultimately the data you are analyzing and how the analysis is used will affect what you think is better. Work with the people who use your visual to make a decision and let them help guide you for the best visual.

    In this case, A loves seeing she’s ahead almost all the time.

  • A New Word: Trumspringa

    trumspringa – n. the longing to wander off your career path in pursuit of a simple life, which is just the kind of hypnotic diversion that allows your thoughts to make a break for it and wander back to their cubicles in the city.

    Such an interesting word. I know I had this when I was working at JD Edwards (and later Peoplesoft) in Denver. My wife certainly had it. In some sense, she’s made this come true and it’s no longer a longing. It’s semi true for me, though I still work at a desk.

    Coping with stress and struggles have had me often thinking what else could I do. I still do this a little, though not more than just as a diversion since I have a great job. More now I look to find ways to actually wander away and try something new.

    From the Dictionary of Obscure Sorrows

  • Speaking at SQL Saturday South Florida 2023

    speaking at SQL Saturday south floridaI have never been to the South Florida SQL Saturday. There have been a bunch of events, but for some reason I’ve never been to one. I was excited when I saw this event planned and the date worked out.

    I found out that I was picked and I accepted. Now I need to plan a trip and get organized.

    I’ll be talking about Database DevOps, so if you can get to the Miami area in early June, I’ll see you there.

  • Restore One Backup From Many in a Device–#SQLNewBlogger

    I wrote recently about finding multiple backups in a file. This post looks at how to restore one of those. The one you choose.

    Another post for me that is simple and hopefully serves as an example for people trying to get blogging as #SQLNewBloggers.

    Setup

    In the previous post, I did these things:

    • took a backup
    • added a table and data
    • took a second backup
    • truncated the table
    • took a third backup

    If I restore the default last backup, I get my table without data. You can read that post to see how I got here.

    Let’s restore things.

    Restoring a Backup

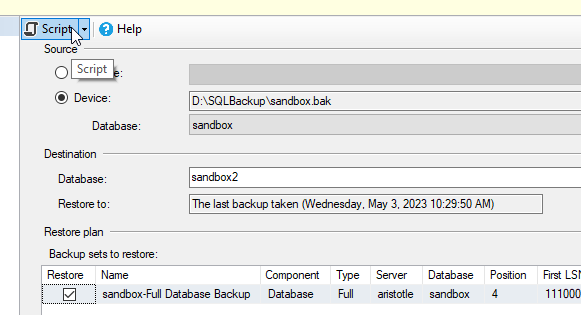
    I cheat with restores. I remember some syntax, but typing it in and trying to remember the order is a pain, even with SQL Prompt. So I click restore database in SSMS and fill out the dialog. I pick the device and when I change the name in the Destination database, the file names change. Once I have the dialog below, I click “Script” at the top.

    2023-05-03 10_46_36-Restore Database - sandbox2

    This gives me code in a new window. In my case, I get this code:

    USE [master]
    RESTORE DATABASE [sandbox2]
    FROM  DISK = N'D:\SQLBackup\sandbox.bak'
    WITH  FILE = 3, 
    MOVE N'sandbox' TO N'C:\Program Files\Microsoft SQL Server\MSSQL15.MSSQLSERVER\MSSQL\DATA\sandbox2.mdf', 
    MOVE N'sandbox_log' TO N'C:\Program Files\Microsoft SQL Server\MSSQL15.MSSQLSERVER\MSSQL\DATA\sandbox2_log.ldf', 
    NOUNLOAD,  STATS = 5

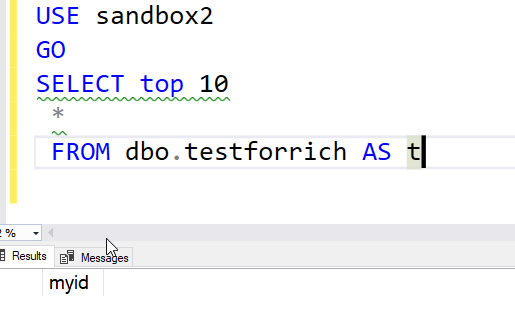
    By default, this gives me file=3, which is the third backup. If I run this and then query the new database, I see this:

    2023-05-03 10_48_41-SQLQuery11.sql - ARISTOTLE.sandbox2 (ARISTOTLE_Steve (55))_ - Microsoft SQL Serv

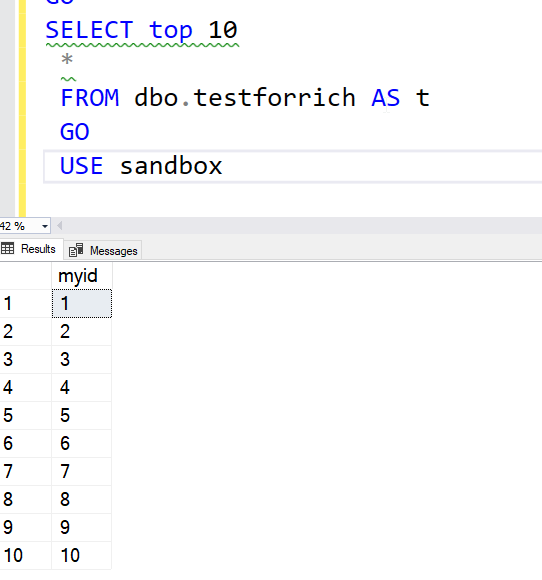
    That’s what I expect. The third backup had the table with no data. Let’s restore the second one. First delete the database and then change File=3 to File=2. Once I run the restore and the same query, now I see data:

    2023-05-03 10_51_49-SQLQuery11.sql - ARISTOTLE.sandbox (ARISTOTLE_Steve (55))_ - Microsoft SQL Serve

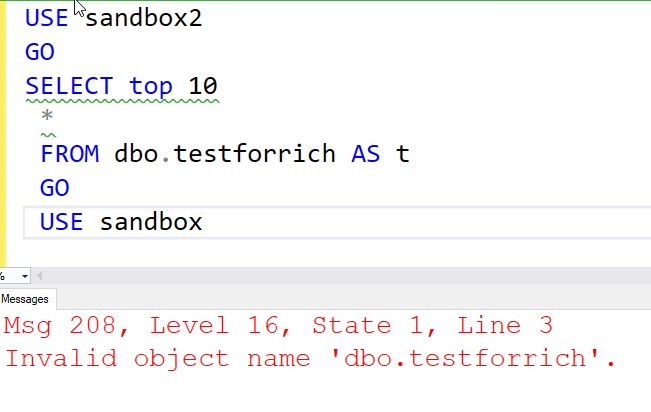
    If I restore file=1, then there is no table.

    2023-05-03 11_04_47-SQLQuery11.sql - ARISTOTLE.sandbox (ARISTOTLE_Steve (55))_ - Microsoft SQL Serve

    Alter the FILE parameter to pick the backup in the file.

    SQL New Blogger

    This post took less than the 10 minutes of the previous post. I basically restored my database a few times with a query. The code was a couple minutes to generate and modify in SSMS, and this writeup was short.

    The key was doing this immediately after the previous post and reusing the setup and code. Plus, the concept was in my mind.

    As with the previous post, this is a good way to show knowledge and learning, and in this case, 20 minutes got me two posts.