Author: way0utwest

  • Better Communication of Information

    Many of us work with data in some way that helps a customer better understand data, use it to make a decision, or support a some conclusion. The way we present data (or help others present data) can impact how well a consumer understands the information represented by the data. There are people whose job it is to design visualizations and ensure the final product communicates well, but often I find a developer or DBA is the person that gets asked for help.

    What do we recommend when looking at a set of data and deciding how to format it? A few posts I saw recently help with decisions (when should I use a map) or basic knowledge (what is a square chart). I’ve seen presentations that help me understand the impact of my decisions and how to better design my informative reports for more people. In fact, I hope more people produce content on how and why they have built reports. It’s helpful for many of us that would like to do a better job.

    The other side of this is actually producing some report and then getting feedback on it. I’ve been working on a report for the kids I coach and need to write some blogs on the way I’ve built report and how I think others might use it. I certainly could use some feedback and I know someone will have suggestions on how to better structure a report, color it, choose a different style, or something else.

    I might even get some better feedback on how I chose to store the data. That certainly isn’t a set or known thing, and I would guess that there are some things I haven’t thought about in building a structure.

    Ultimately there is information to be gleaned from the data we capture, store, and manage. While it might not be our job to help convey that information, we are a part of the process and the more we know about it, the more we might do our jobs better, or help others do theirs better. I do hope that I see more posts on not only how to query information and solve problems but how to better present the data from those queries.

    I’m looking forward to some blog posts, articles, or maybe even someone hosting a T-SQL Tuesday on this topic.

    Steve Jones

    Listen to the podcast at Libsyn, Stitcher, Spotify, or iTunes.

  • Daily Coping 20 Jun 2022

    I started to add a daily coping tip to the SQLServerCentral newsletter and to the Community Circle, which is helping me deal with the issues in the world. I’m adding my responses for each day here. All my coping tips are under this tag.

    Today’s tip is to send a positive message to a friend who needs encouragement.

    I get these sometimes from friends, and I love them. I also try to remember to do this.

    I had a friend that had to go through a tough time with a family member being sick recently. Everything is fine, but I know the aftermath of this and trying to get back to normal is hard. I made it a point to reach out every day or two for a few days to check on them and just offer encouragement.

    You could do that randomly as well, even if someone isn’t needing encouragement. Just let them know you are thinking of them.

  • New in SQL Server 2022 – Generate_Series

    One of the new language features added in SQL Server 2022 is the GENERATE_SERIES function. This allows you to generate a

    SELECT * FROM GENERATE_SERIES(start=1, stop=7)

    This gives me a simple sequence of numbers in a result set, with the column header, value.

    2022-03-31 14_57_20-SQLQuery3.sql - ., 51433.sandbox (sa (80))_ - Microsoft SQL Server Management St

    Let’s take this code from Dwain Camps article, Tally Tables in T-SQL:

    DECLARE @S VARCHAR(8000) = 'Aarrrgggh!';
    SELECT value, s
    FROM
    (
         -- Always choose the first element
         SELECT value=1, s=LEFT(@S, 1) UNION ALL
         -- Include each successive next element as long as it’s different than the prior
         SELECT value, CASE
             WHEN SUBSTRING(@S, value-1, 1) <> SUBSTRING(@S, value, 1)
             THEN SUBSTRING(@S, value, 1)
             -- Repeated characters are assigned NULL by the CASE
             END
         FROM GENERATE_SERIES(start=1, stop=100)
         WHERE value BETWEEN 2 AND LEN(@S)
    ) a
    -- Now we filter out the repeated elements
    WHERE s IS NOT NULL;

    Now the original code has a CTE that generates the series, or tally table. I’ve replaced that with GENERATE_SERIES. The code works as expected, which in this case is to remove repeating characters.

    2022-03-31 14_58_21-SQLQuery3.sql - ., 51433.sandbox (sa (80))_ - Microsoft SQL Server Management St

    SQL Server 2022 is now out in preview and I’d urge you to give it a try. This is a neat new feature, and it does provide more standard code than the variety of ways I see people building tally tables.

    I haven’t tested performance, but I am hoping it does as well as cross joining system tables or using a CTE.

  • Tesla Power Use in Summer and Winter

    This is part of a series that covers my experience with a Tesla Model Y.

    When I look at my top destinations in the Tesla, I find that home is the top one (327) and my gym is second (102). That seems about right as I go to the gym 3-4 days a week and usually run some other errand then.

    2022-06-07 08_51_39-Drive Stats - Grafana — Mozilla Firefox

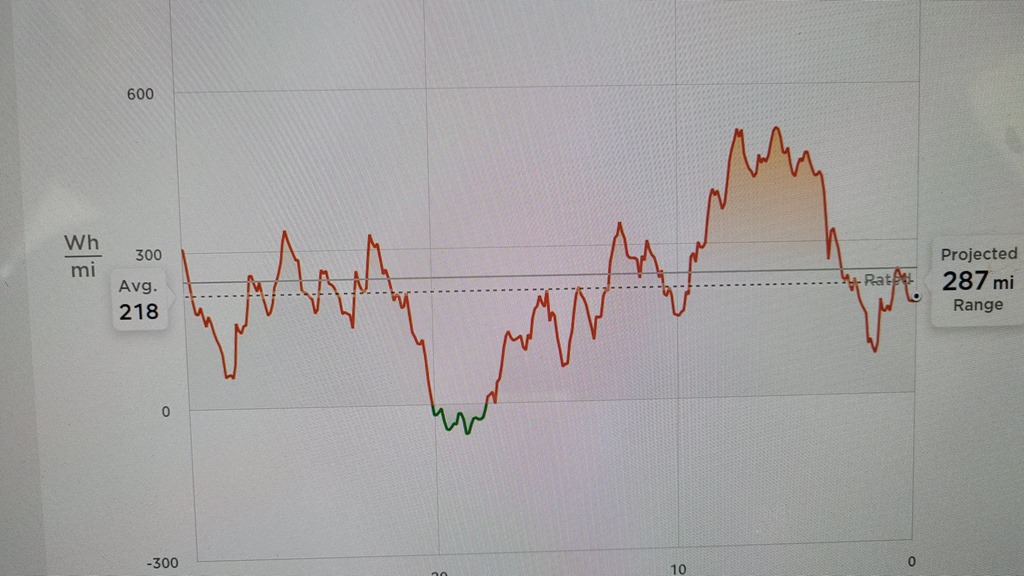
    When we got the Tesla and started to drive a bit, I found myself enamored with the Energy usage screen. It tracks the last 30 miles (configurable) and gives you a range estimate. Here is a typical screen for me:

    20210922_161212

    This shows the energy usage as I drive, with the most recent mile on the right and the oldest (30th) on the left. I see the amount of watt hours used at that time and then an average. There’s also a solid horizontal line for the rated range.

    For this 30 miles, I averaged 218Wh/mile, which is pretty good. You can see there are some high spikes in the 500Wh/mi range and some low ones. The green areas are where I actually recovered some energy back. This was at the lowest point leaving my house and heading West to Parker, CO, which is about 800 feet lower in elevation. I actually am generating power with the regenerative braking thanks to gravity.

    The Gym Run

    I go to the gym regularly, often 3-4 times a week. It’s an easy drive, and I’ve played the energy video game for years, trying to use the minimum amount of gas (Prius) or power (Tesla) on my trip there. I found this to be fun, and I’ve beaten my high (or low) score a few times.

    With the Tesla, it’s been an interesting metric to see how much power I used in the summer and winter. I grabbed a few screen shots in the fall when the weather was warm and then again in the winter. Here’s what I learned.

    Summer(ish)

    Here’s a summer graph. This trip was a 72F day, so not too summer-ish, but warm. A pleasant day. The drive stats are:

    • 11.8mi
    • ~2% battery used downhill
    • 21 minutes
    • 133 Wh/mi downhill
    • 1.6kWh

    The return home is as little different as I went to the grocery, but I had:

    • 9.8mi
    • ~4% battery used
    • 342 Wh/mi
    • 3.3kWh

    This is reflected in my graph for the downhill. The arrow is about where I start from home and the end is the gym. Lots of downhill, though not all. I was trying to be careful here and managed to get my 30mi average down to 184Wh/mi.

    20210922_142615

    This was pretty good to me, though admittedly I don’t have any point of reference as this is my first electric car. In terms of cost, this still is about US$0.69 for the drive. As a point of comparison, the X5 would cost about a gallon of gas. Around US$3.20 back then. The Prius would have been US$1.47.

    Winter

    A similar trip, slightly longer, so I must have varied the route a bit, but I see this:

    • 12.0mi
    • ~3% battery
    • 228Wh/mi
    • 2.7kWh
    • 33F

    The return:

    • 10.2mi
    • ~5% battery
    • 360Wh/mi
    • 3.7kWh
    • 28F

    The temperature dropped here, and as you might have guessed, I was using the seat and car heaters.

    What is interesting here is the downhill show 133Wh/mi in summer and 2.7 in winter, a significant change. The uphill has less of a difference ( 3.3 v 3.7kWh). Gravity is a bigger issue, I’m guessing. Maybe some battery conditioning on the downhill as well, but that’s still a factor.

    The cost in winter is more like US$0.90. While the BMW is still in the 20-21 range in winter, the Prius dropped from 47-48mpg to 42mpg, so it also showed a bigger battery effect in cold weather.

    Conclusions

    I don’t quite know what to make of this, other than expect range to shorten in the winter and plan for more charging. In general, since I mostly charge at home and my daily trips never get close to the range limit, this doesn’t change anything for me. We will use more power in winter, but since we don’t have time of day (or year) cost changes, and we have solar power to somewhat stabilize the cost of power, I don’t worry about this affecting my life.

    We have learned to cut off Sentry mode and also to charge a little more in cold weather if the car is sitting outside and unplugged. It’s not a big deal, but it is something to think about if you have an electric car in a cold climate. A little more forward thinking is needed in this paradigm.