I read Carlos Robles blog on creating an Azure Data Studio (ADS) insight widget and decided to try this for myself. I decided to try and get a list of object types and a count of each. Following instructions, here’s what I did.
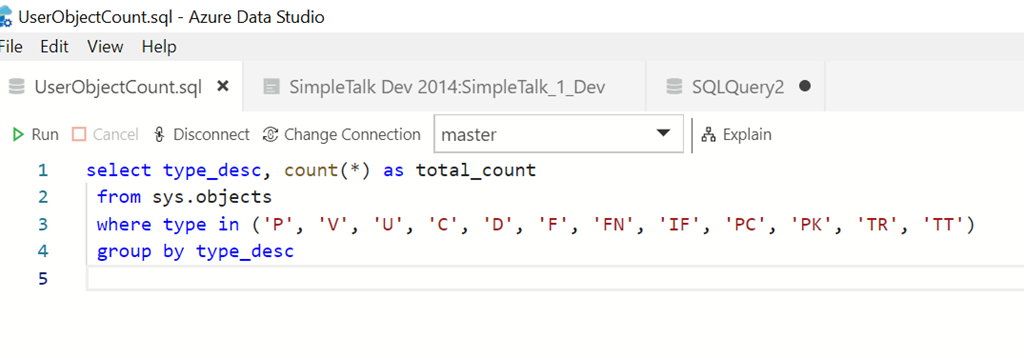
First, I wrote a query that would gather the types of objects and counts from sys.objects.
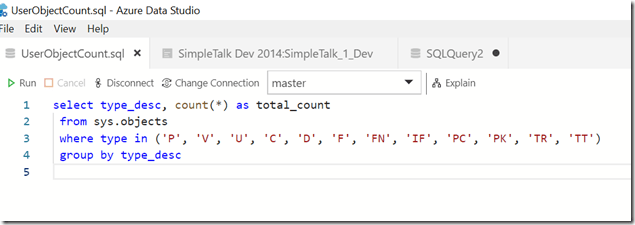
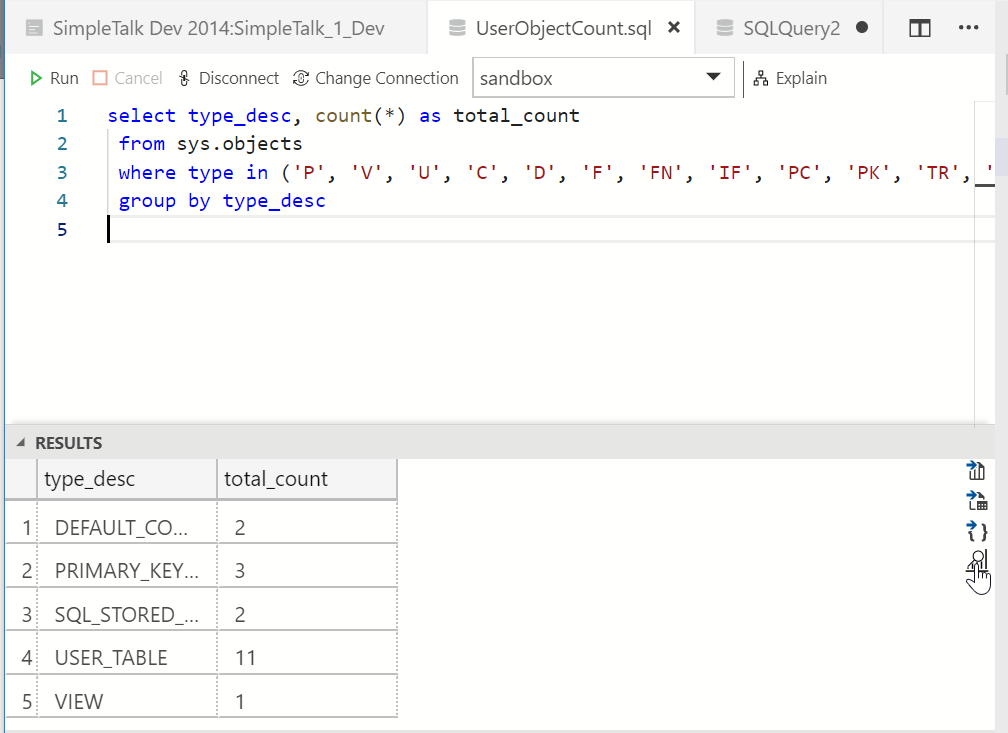
I saved this as a file under my Documents folder. Once I had this, I ran the query and in the results, I clicked on the Chart item to the right of the results.
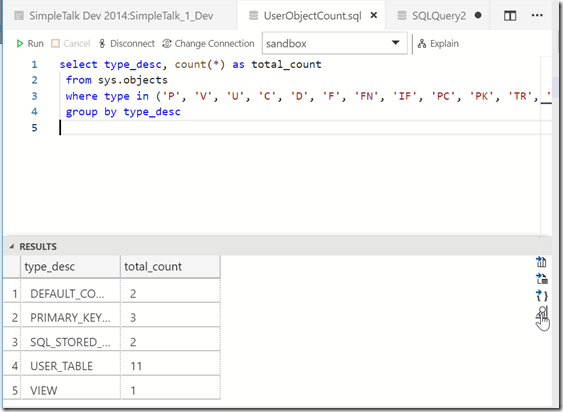
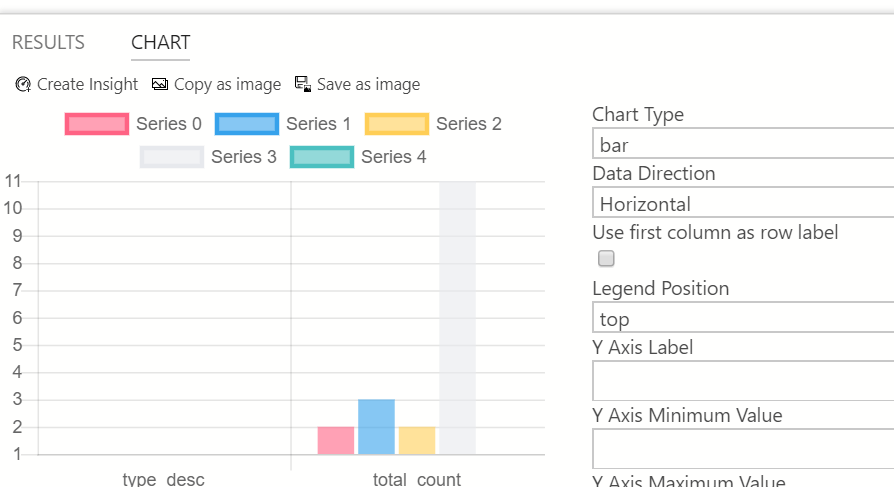
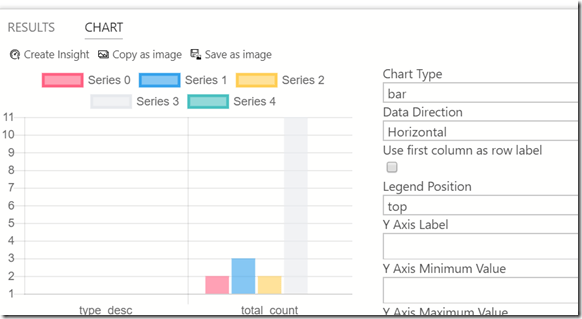
This displays a bar chart, which is useful at times, but that’s not what I want.
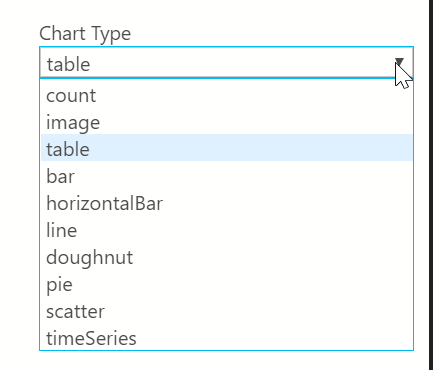
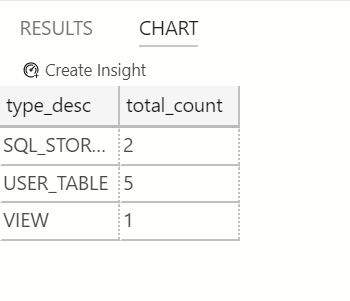
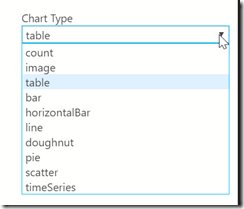
Instead of this, I’ll expand the Chart Type drop down. This gives me a list of a number of items I can choose. For this insight, I’ll use the table type.
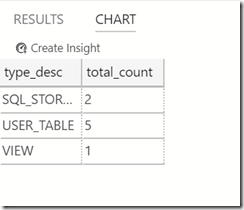
Once this is done, I’ll see the results I want. There is a “Create Insight” button above the chart. I’ll click this to get the JSON code that creates this.
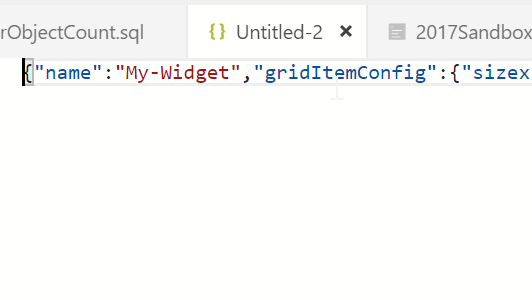
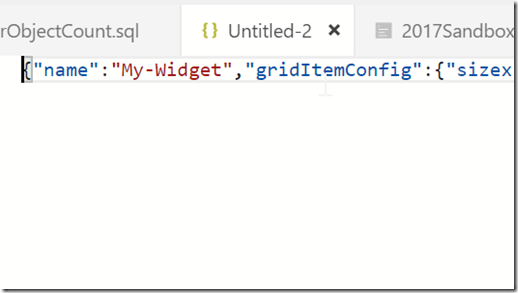
A new editor tab opens with the JSON code in it. This is just one long line of code, which isn’t as helpful or easy to work with.
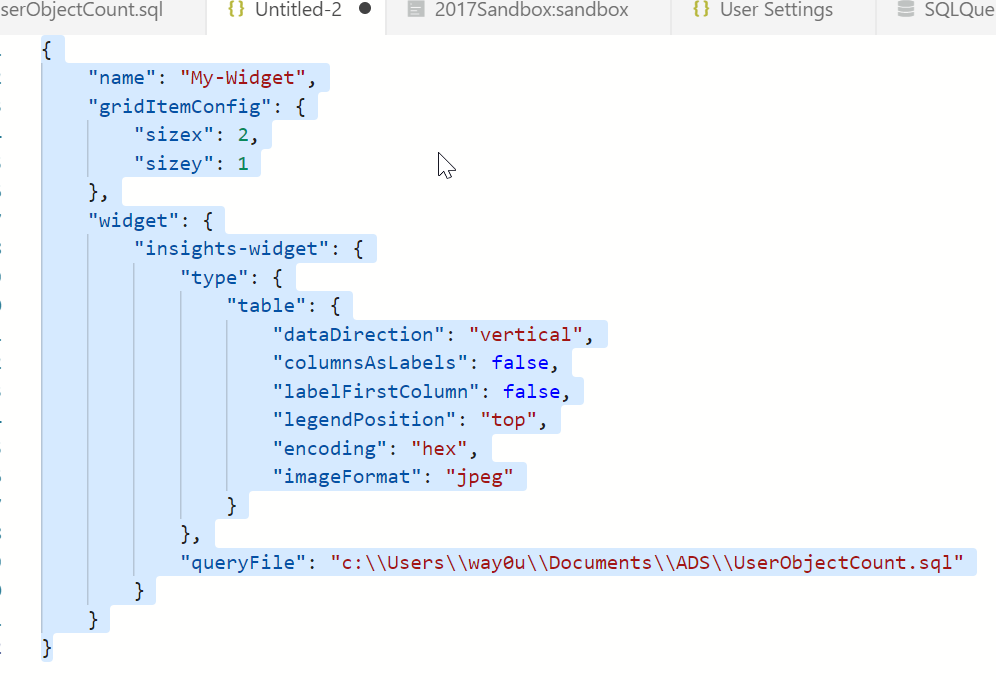
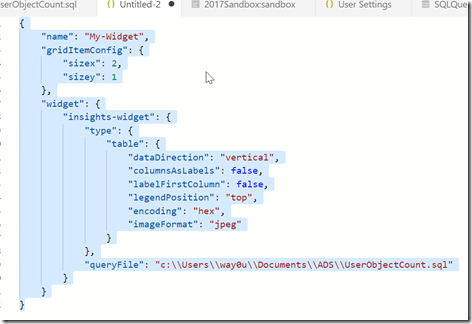
CTRL+Shift+P opens the command palette. Type “format” and you’ll see the Format Document command. Once you format the code, it will be easier to read.
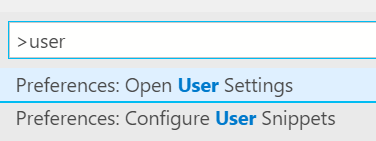
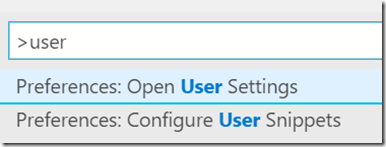
The next step is to open the user settings. This is also in the command palette.
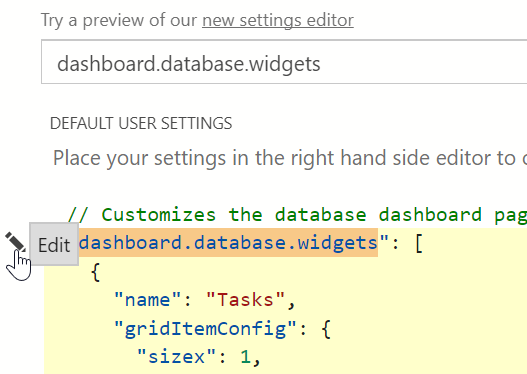
In my ADS, I get the settings list. I can search for dashboard and I’ll find the one I want.
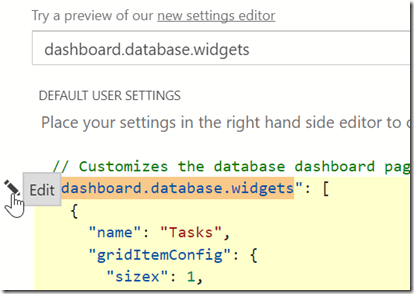
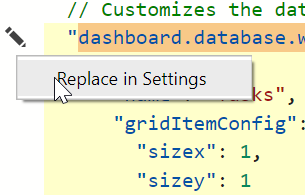
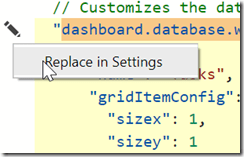
If I put the cursor in the upper left, I’ll get an edit item. I can pick this and I’ll get one of two items. If I’ve never customized anything, I’ll get the “copy to user settings” option. If I have, I get the “Replace in settings” item.
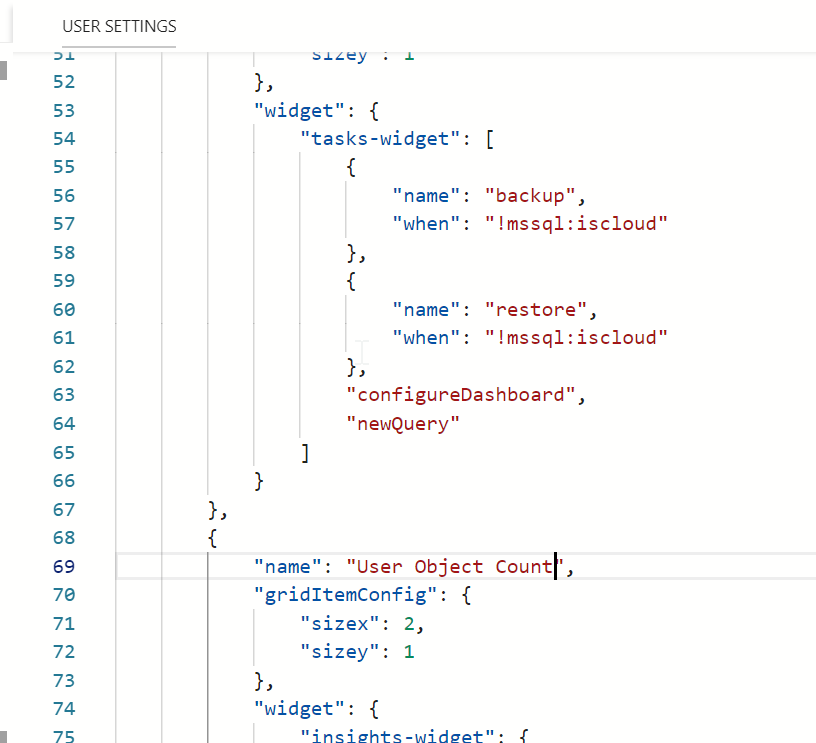
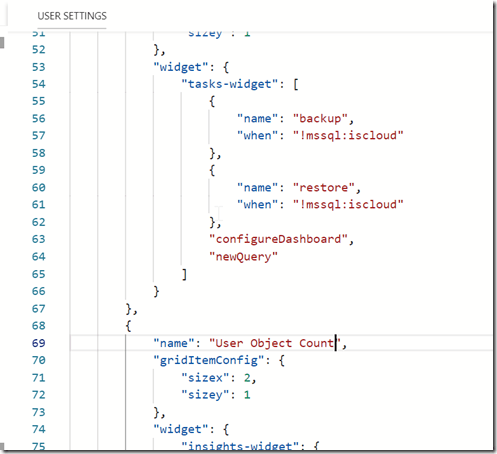
Once I’ve done this, I want to modify some code. I don’t love the search box, so I’ll delete that json widget. Then I paste in my widget code. Be sure you put this in the right place, with a comma between the widgets braces. I changed the name from “my-widget” to “User Object Count”.
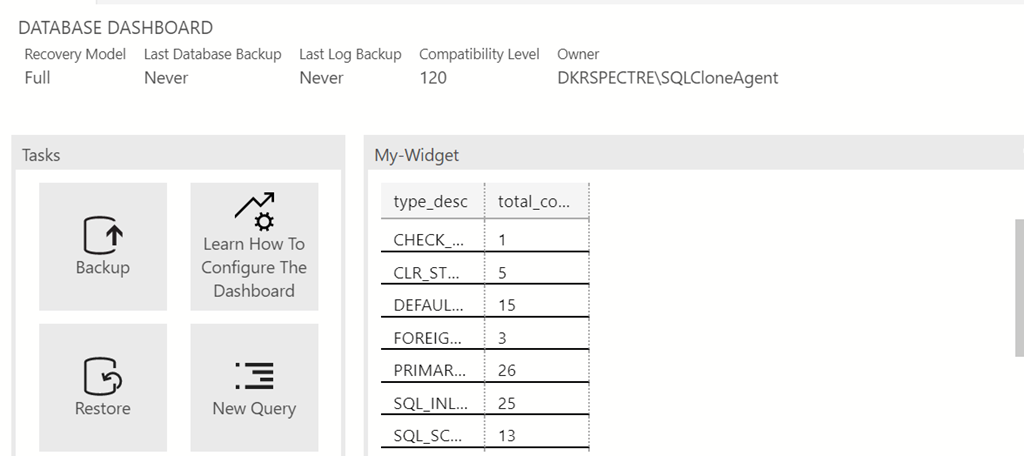
Once I do this, I save it and close it. Then I double click one of my server connections and I see my widget on the dashboard.
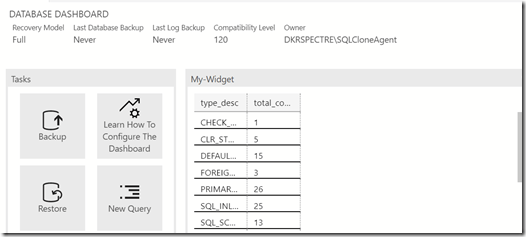
Pretty easy to get a query to appear on your dashboard as a chart if you want to get some insights. Any query could be used, with the results returned when you open the server connection. You can also leave the dashboard open and refresh it when convenient.