Tag: Power BI

  • Power BI Dashboards

    This is part of a series on my preparation for the DP-900 exam. This is the Microsoft Azure Data Fundamentals, part of a number of certification paths. You can read various posts I’ve created as part of this learning experience.

    I don’t know a lot about Power BI. I’ve lightly hacked and played with it, but it has evolved and changed so quickly that I needed to dig into some concepts.

    Power BI Dashboards are a part of what you need to know for this exam. Over the years, I’ve lightly made a few reports, but not dashboards, so this was an area I needed to study up on a bit, especially these concepts.

    Dashboard Basics

    A dashboard is different from a report. A dashboard is

    • a single page
    • available in the Power BI Service only (not Power BI Desktop)
    • composed of tiles
    • can use data from one or more reports, and more than one dataset
    • one dashboard can be featured
    • supports natural language queries
    • can’t see the underlying data, but can export data

    Tile Sources

    A tile can be from:

    • a report (a visualization)
    • another dashboard
    • an Excel workbook in OneDrive for business
    • Quick Insights
    • An on-premises paginated report from Power BI Server or SSRS

    There can be standalone tiles for  images, text boxes, video, streaming data and web content.

    These are a series of facts I think are important to understand about Power BI Dashboards

  • The PowerBI Volleyball Report – Organizing Data To Start

    One of my goals this year was to build a report that I can present to kids and parents showing the skills progression of their kids. I have attempted a few times to put something together in Excel, but it wasn’t easy for parents to visualize, and I wanted something better to let them focus on a specific kid, without making the data hard to consume. Power BI makes this easy.

    This post looks at my data capture process, and how I evolved it a bit to make this easy to handle in Power BI.

    Data Capture

    I’ve tried a few ways to gather data during matches, but paper turns out to be the easiest way to ensure this happens quickly and fairly accurately. While there are a number of apps, I find them problematic as one wrong press means the data capture stops, and I can then miss the next item.

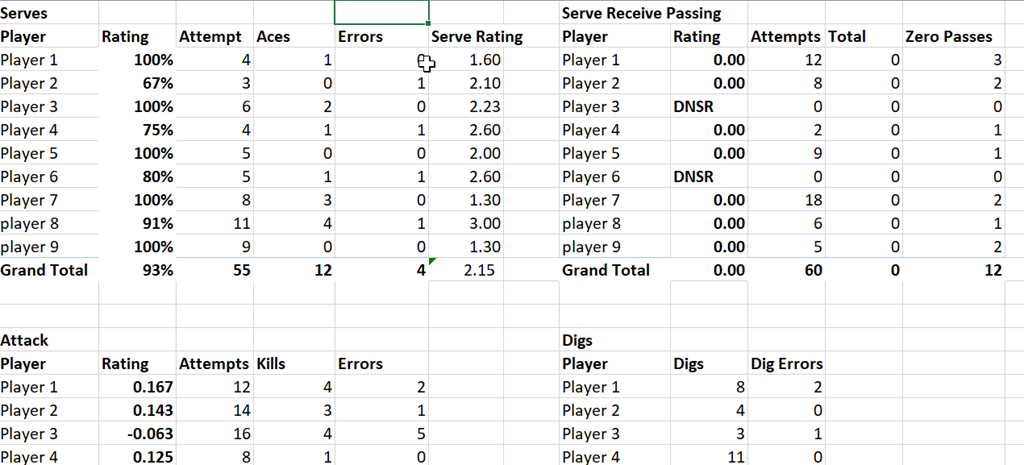
    I used to calculate all totals by hand and then put them in a spreadsheet for parents after each competition, which worked well, but this format isn’t easy for Power BI to deal with.
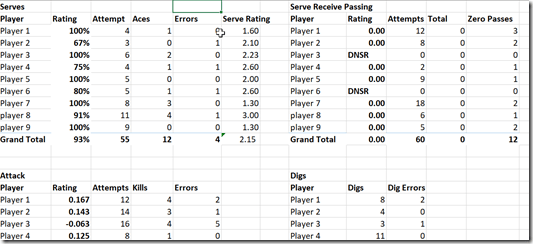
    2021-07-28 14_12_31-Stats2022_16Select.xlsx - Excel

    Easy for humans, but bad for reporting.

    As a result, I stopped to think what would be good and easy for Power BI. A table is best, and while I don’t want to bother with a database, I can modify my Excel formula easily enough to handle this.

    Since I will report on different areas, I decided to keep a master sheet for each report area. This means I have a “serve” worksheet, as well as others for Serve Receive, Attack, Digs, Blocks, and Assists. I can also add in new sheets as needed.

    Making a tabular format means that I added a few columns to this list. These columns are the slicers that atheletes and parents might want to use when they are reporting. In my case, these are:

    • date of event
    • event name
    • opponent
    • player

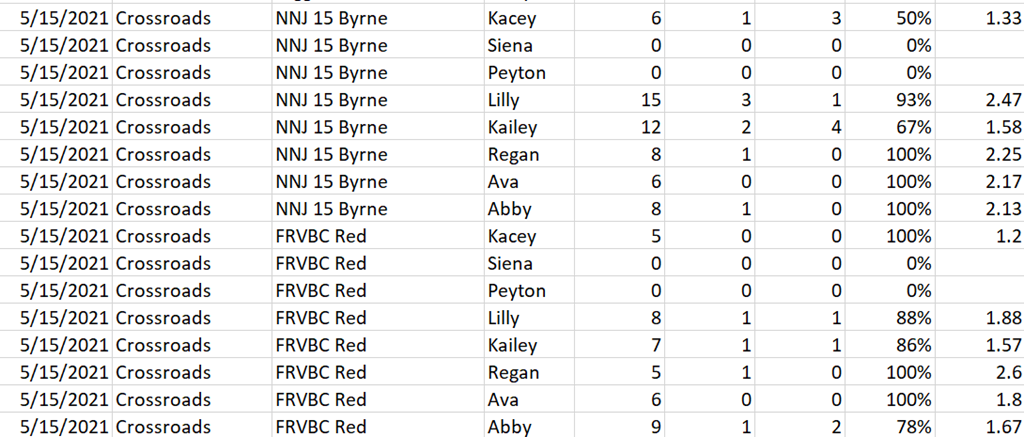
    With these columns, I can take my paper sheets, type in the raw data, and let Excel do a few calculations. This also means my main report is just a few sums from these raw sheets to get the totals above. From last season, I had data like this:
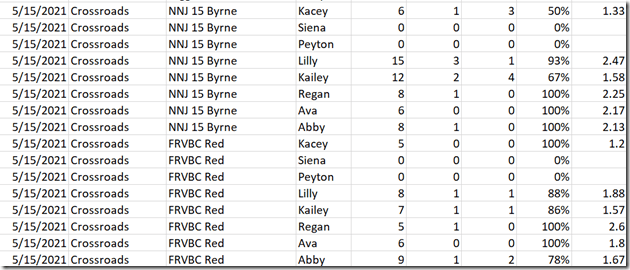
    2021-07-28 14_19_37-Stats2021_15Select.xlsx - Excel

    I also decided to enter data in the same order each time so that once I have a sum to copy data from this sheet for one player, I can copy/paste those formulas for the rest. This keeps the burden low for post game work.

    This also means that when I “Get Data” in Power BI, I just load data from each worksheet into a separate table in Power BI. This allows separate reports that are simpler to produce, as much of this data doesn’t make sense when combined together. This also means that I don’t have one huge table where I’m trying to manage data and potentially scrolling around a lot from left to right. This also means I can load this into SQL Server easily if I want to.

    This also means I need to set up incremental refresh in Power BI.
  • DAX and Power BI Stairway Live

    As part of the Redgate Community Circle, I’m going to be running a live class on DAX and Power BI, every Thursday, from 12MDT for about 30-45 minutes. We’ll see how things go.

    I’ve been wanting to learn DAX and I keep putting it off. I can google with the best of them and fumble through things, but that’s not ideal. And it might not be correct, as I’m not sure I’m always writing the code that I need, or the best code. So I want to walk through Bill Pearon’s Stairway to DAX and Power BI live.

    Join me and we’ll work through the series, learning some DAX and applying it to Power BI, which will be interesting. I will read the articles ahead of time, and download anything I need, but for the most part, I’ll be fumbling along with you.

    If  you’ve got time, join me live. The webinar link is here, and you’re welcome to join, for the whole time or just a part. I anticipate things going for 30+ minutes, but I’ll cut off at an hour. Feel free to participate and as long as we don’t have too many people, we can all discuss the article and try things out live.

    For security, I’m not directly posting details, but here is some of it.

  • Learning some DAX

    I’ve not done much BI work in my career, other than simple aggregates in reports. I’ve wanted to tackle projects, but I’ve rarely had a chance to spend time in this area at work.

    Recently I had a bit of time and decided to look at some Power BI courses.  At Pluralsight, when searching Power BI, I got a learning path that showed a number of courses from different authors. In the intermediate track, the first course was from Eugene Meidinger.

    2019-12-09 13_40_32-Microsoft Power BI for Analysts Path _ Pluralsight

    I met Eugene last year at SQL Saturday Pittsburgh and decided to give his course on Getting Started with DAX Formulas in Power BI, Power Pivot, and SSAS. Not quite what I wanted, but since I was curious about DAX, I decided to give it a try.

    Understanding DAX

    The intro is interesting. Eugene makes a good case for why DAX is important in the Microsoft stack. I tend to agree as I see this being incorporated into many products, including Excel. I’ve felt somewhat out of touch in that I haven’t known much about it and how it works. Even when I flip through our Stairway series, I’m somewhat skimming and haven’t really understood what it means.

    I think Eugene does a good job of trying to explain DAX as different than, but similar to Excel. Thinking of this as an expression language, rather than a query language, isn’t something I’ve considered. Maybe I’ve heard this, but it didn’t stick.

    He also lets me know this isn’t easy, which is what I’ve thought. I’ve seen Bill Pearson and Reza Rad talk some DAX, and it wasn’t quite clear to me. It felt clear when they were speaking, but not later. I’m hoping Gene teaches me a bit more in my office rather than in a 1 hour session.

    Going Through the Overview

    I went through the first few modules, which give you an overview and basic understanding. Eugene tries to explain the differences between DAX and SQL, which is a good way to approach the problem. Many of us are familiar with SQL, so this is helpful.

    The third module starts to get into data governance and where you use DAX with your data. This is interesting, and it’s a good look at what type of organization you deal with for data. How is your data managed, which is something that most companies don’t really have a good, or consistent, data governance strategy.

    One good thing is that Eugene explains  the different places where DAX is supported for queries. That’s good since I’ve been thinking of DAX as the Power BI language, but it’s not. It can be used in Excel with PowerPivot.

    The fourth module is the one where we start to understand column storage and the value this gives us. Still no DAX, but it’s a good module for analysts and relation people.

    In getting through 4 modules, no real technical stuff that’s helped me, but it’s given me a little better baseline.