Tag: Redgate

  • The Book of Redgate: Do the Right Things

    I do believe that Redgate has been very customer focused since it’s inception. I’ve worked with them in some capacity since 2002 and I’ve felt this along the way:

    2026-02_0177

    The next page has this statement:

    We believe that if we do what is right for our customers then we will thrive.

    I think that’s been true when we keep this in mind. The (relatively) few times we’ve started to do things for ourselves rather than thinking about customers, things haven’t worked out as well.

    I think this sentiment is one that guides a lot of my life. Certainly inside Redgate, but also in the rest of my life. If I do what is best for another, or the world, often that works out well. It doesn’t mean I’m as efficient, profitable, less stressed, or anything else as I could be.

    But I’m happier and I thrive.

    I have a copy of the Book of Redgate from 2010. This was a book we produced internally about the company after 10 years in existence. At that time, I’d been there for about 3 years, and it was interesting to learn a some things about the company. This series of posts looks back at the Book of Redgate 15 years later.

  • Monday Monitor Tips: Oracle Custom Metrics

    One of the popular features of Redgate Monitor has been the ability to add custom mertics for various purposes. This has been popular, and along with our curated list at sqlmonitormetrics.com, it’s a feature that’s used by many.

    It has been a SQL Server only function for awhile, but customers have requested other platforms. We’ve added the capability for Oracle and PostgreSQL.

    This is part of a series of posts on Redgate Monitor. Click to see the other posts.

    Adding Custom Metrics

    You can see on my custom metric config page that I have a few business metrics added. I recommend these to customers as often a business metric catches an issue before it appears in Perfmon type data. Let’s add a new metric. I’ll click the

    2026-04_0236

    I’ll click the “Add a custom metric on the right side” and will get a new form.

    2026-04_0237

    This form used to be mostly the same, but the “Choose where to collect data from” didn’t have a drop down. It only had the 1. Select instances and the 2. Select databases (to the right). This new drop down is where you pick the platform.

    2026-04_0238

    If I click the drop down, I see three choices: SQL Server, Oracle, and PostgreSQL.

    2026-04_0239

    I can select Oracle and my select database section disappears. This is because an instance and a database are the same thing in Oracle.

    2026-04_0242

    If I select PostgreSQL, I can still select databases.

    2026-04_0240

    The rest of the form works the same way. When I’ve selected Oracle, I get a default query listed that lets me know the structure of my result set. I need to return an integer with the con_id, a metric value that is a scalar and an optional string with details.

    From there things work as they do with other metrics.

    Summary

    This post shows a new capability in Redgate Monitor for Oracle, where you can track your own data, as you see fit, and then let Redgate Monitor alert on changes, graph this over time, and help you better understand your system.

    We are enhancing and adding to Redgate Monitor every week, but there are always more things that many of you want, and custom metrics give you the ability to choose what you want to monitor.

    Redgate Monitor is a world class monitoring solution for your database estate. Download a trial today and see how it can help you manage your estate more efficiently.

  • Changing the Cardinality of a FK in Redgate Data Modeler

    One of the things a customer asked recently about Redgate Data Modeler was how to adjust a FK constraint between two tables. The tool seemed to makes this  easy, and this post will show you how.

    This is part of a series on Redgate Data Modeler.

    Altering a Constraint

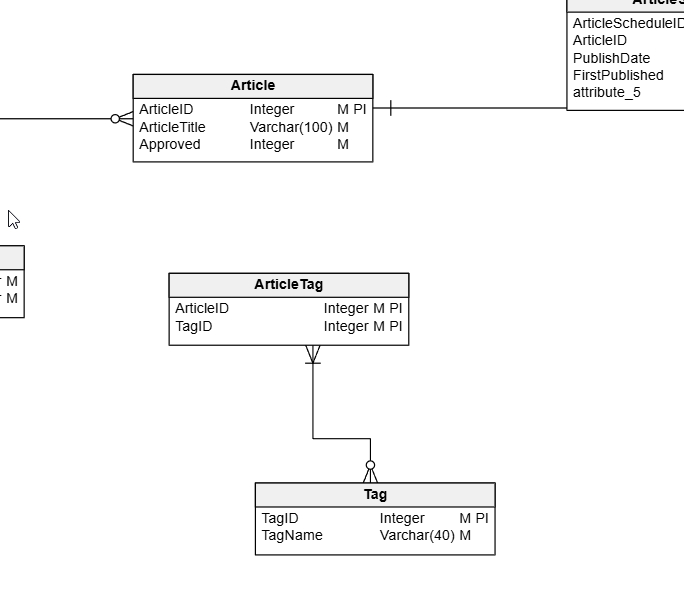
    In a previous post, I looked at adding a FK. Let’s do things a little differently here. Let’s change a constraint to better reflect the relationships between entities. In this case, let’s look at a part of my model. I have the User and Author entities linked as shown below. Note that we have a User with a 1:many relationship to Author.

    2026-04_0213

    This isn’t correct. A User cannot be a part of multiple authors. This is, logically, a 1:1 relationship. Each Author is related to one and only one User. Each User can be an author, but only one Author. So let’s fix this.

    If I click on the relationship, it turns blue and highlights.

    2026-04_0214

    On the right side, the properties pane displays the relationship properties. Note that there is a relationship type below the comment.

    2026-04_0215

    If I click the  drop down, I can change this to whatever cardinality makes sense.

    2026-04_0216

    I’ll choose one to one. When I do that, I can see the diagram changes.

    2026-04_0217

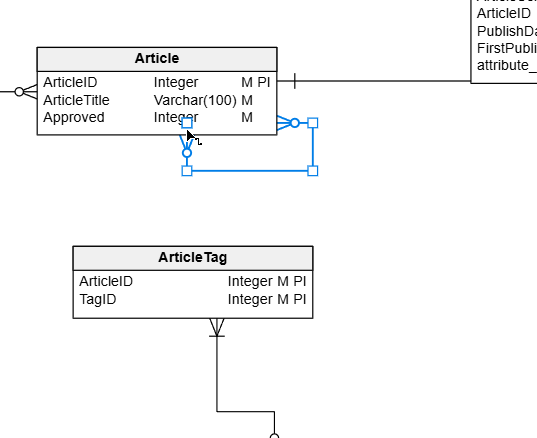
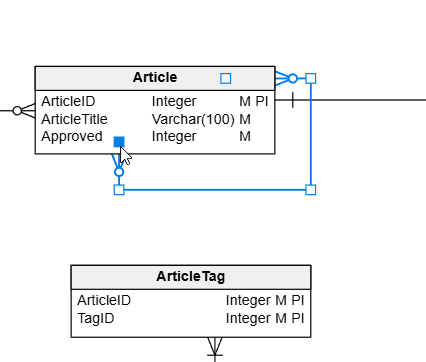
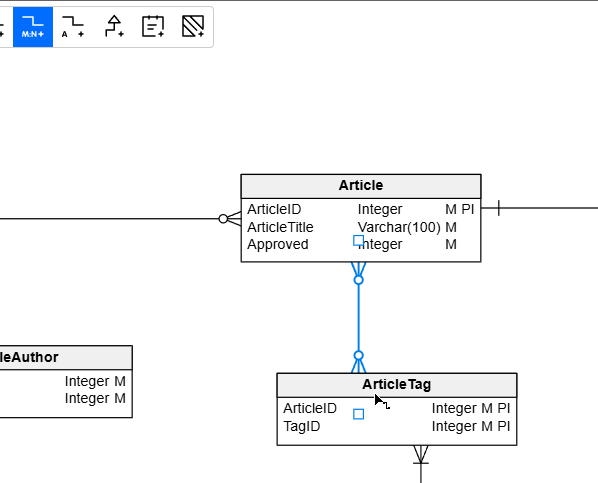
    I can also change this for other entities. Here I have a One to Many, but this is really a many to many relationship. So I need to change it.

    2026-04_0218

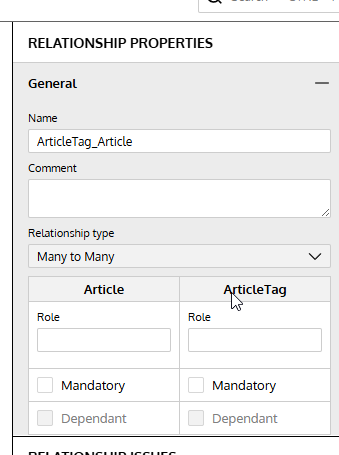
    I can adjust the properties in the drop down and you can see both the diagram and the right properties pane match.

    2026-04_0219

    Summary

    We may model our entities incorrectly, either because of incomplete information or simple mistakes. In any case, if you need to change cardinality in a relationship, it’s easy to do in the relationship properties.

    Give Redgate Data Modeler a try and see if it helps you and your team get a handle on your database.

    Video Walkthrough

    Here’s a short video of my working with Redgate Data Modeler and changing cardinality.

  • Monday Monitor Tips: A New Analysis Page

    We have multiple teams (8) working on Redgate Monitor. Some work on the Standard Edition, a few on the Enterprise Edition, and others handling core work, like the Linux/PostgreSQL option.

    We also have designers, and they regularly research how well the product works for customers, what is difficult, and they propose changes. One of them was recently release. We have a new analysis page in Redgate Monitor and this post looks at the changes.

    Video walk-through of this post below.

    This is part of a series of posts on Redgate Monitor. Click to see the other posts.

    The New Experience

    If you go to monitor.red-gate.com, you can see this at: https://monitor.red-gate.com/Analysis. This shows the new analysis graph, which is easier to see and takes up the entire screen.

    2026-03_0166

    If you haven’t used this, I’ve added metrics below this for certain servers. You can see in the legend that I’m looking at CPU time along with batch requests for both sides of my cluster. I can compare these to see if the number of batches is impacting CPU. A correlation I might use to research how a workload affects my system.

    If I put my cursor over the graph, I can get info on the metric, the current time and the value/min/mean/max. These values are for the time period.

    2026-03_0168

    If I change my time period, I see the values change for the stats.

    2026-03_0169

    Below this, for the metrics, it’s a little cleaner as well. The interface hasn’t changed a lot, but it’s a little larger and spread out. I can see that I pick a metric for a cluster, and then for a machine. This is the same.

    2026-03_0170

    What has changed is the “add a metric” is now at the top on the side. If I click this, I get a new set of metrics to pick below this. Note the “same as above” for the cluster, which is very handy. I can also type in the box to search.

    At the right, the explanation of the metrics and statistics are still on the far right.

    This makes an interesting experience that works smoother to ensure that

    The Classic Experience

    If you don’t like this, there’s a link in the upper right to switch back.

    2026-03_0173

    Clicking this loses my metrics, but if I add them back, you can see the old view. It’s a little less appealing to me. The other thing I hated is that the “add a metric” is below the list shown below, which is annoying. I often scroll down to find it.

    2026-03_0167

    I also have statistics which only show one of the metrics (first one?) and not both. I’m also missing stats of the average.

    2026-03_0174

    Summary

    This is a small change, but a nice one, IMHO. The ease with which the UX is designed can make a big difference to how users can interact with the data. This is a small one, but one that I really appreciated.

    If you have feedback in general, please let us know as we value your opinions and comments on how we shape the future of Redgate Monitor.

    Redgate Monitor is a world class monitoring solution for your database estate. Download a trial today and see how it can help you manage your estate more efficiently.
    Video Walk-through

    Video of this post below.