We aren’t the only company that does this, but Redgate Software does try to be data driven. Across my 18 years, I’ve had plenty of people use evidence from customers, from usage data, from market research, and more to justify a decision.
I think Google and quite a few other companies have called this being “data-driven.”
The text on the next page continues the sentence:
not on people’s opinions, the volume of their voices or who they are. When the evidence changes, we are prepared to change our minds. We will thank, and never shoot, the messenger.
I will say that this has skewed a bit over time, as I find that evidence is subject to interpretation and I’ve certainly seen some people cherry picking evidence to support their decision. Sometimes by asking for certain evidence.
However, we did realize there were issues and have tried to correct. I was part of a yearlong project last year that impacted marketing, product, and engineering where we focused on getting more information from more customers, and especially being careful to get evidence from multiple sources, including different geographies. We had a bias to the UK, so we tried to correct for that, and I think we made some strides.
That being said, I haven’t seen us shoot or blame the messenger for bad news, though sometimes thanks are sometimes not as sincere as they could be. I understand, because contrary news tends to dampen enthusiasm.
I have a copy of the Book of Redgate from 2010. This was a book we produced internally about the company after 10 years in existence. At that time, I’d been there for about 3 years, and it was interesting to learn a some things about the company. This series of posts looks back at the Book of Redgate 15 years later.
I have been experimenting with MCP servers in a few ways, and pressing on our Redgate Monitor team to add one to their system. They did, started adding tools, and are continuing to work. I’m excited.
Here’s a quick look at the MCP server for Redgate Monitor (preview in July 2026).
I’m not going to bore you with the setup and configuration. You do need to be on a 14.23 or later as the version. Your account rep can get you setup instructions, which are still be worked on and finalized. This is really a work in progress as of this writing (Jul 30) and I’ve found a few things that didn’t quite make sense, so be patient. This is editing the Monitor Webserver config file and enabling this.
Once that’s done, it’s a little tricky with an AI agent system. This is the high level, and I’ll do some more detailed notes about getting this in VSCode and Claude, where I work. The basic steps are:
Enable in Redgate Monitor
Create an MCP Access token
Add the MCP config to your Agent setup
It’s not quite as simple as it sounded to me, but it wasn’t that hard. It’s mostly working through some of the steps and ensuring you get your JSON correct.
Accessing the MCP Server
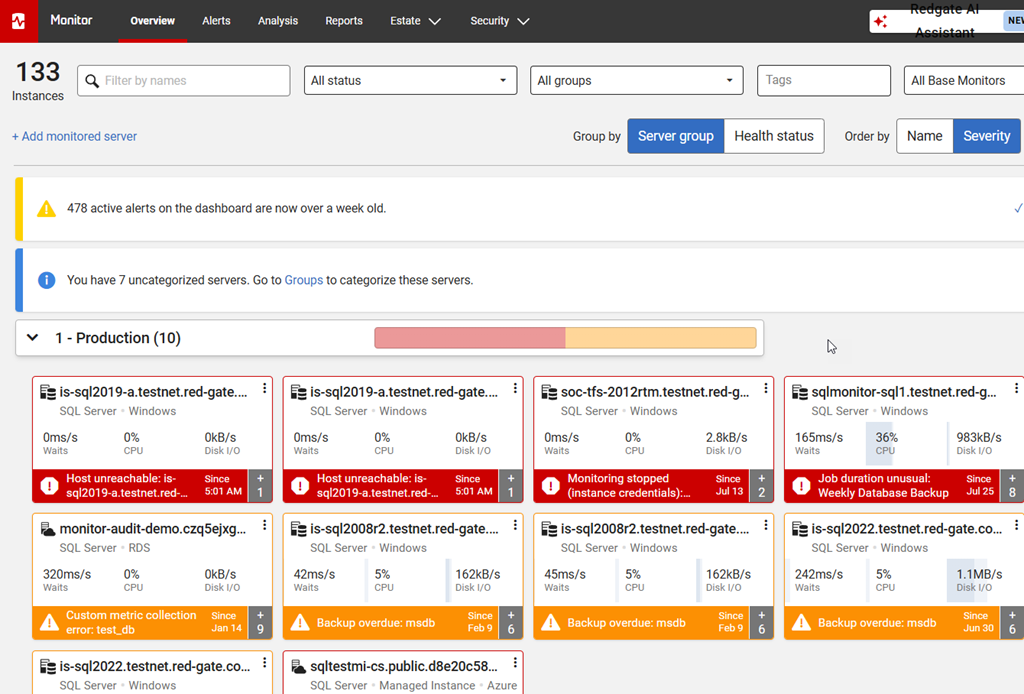
I connected with Claude for the demo in the Video Walkthrough below, but I’ll give you a quick look here. I set my token for the prod/staging/dev systems. When I look at the test instance of Redgate Monitor, I see this: lots of servers and alerts.
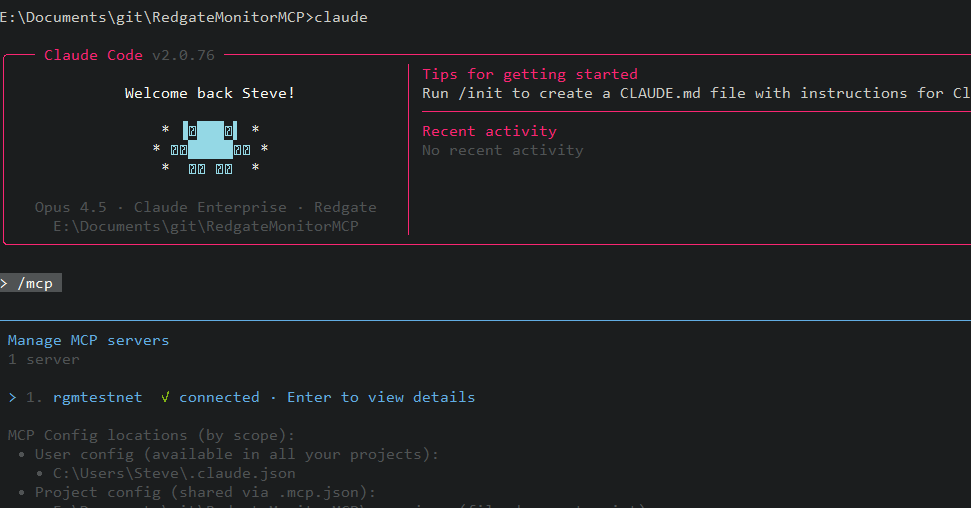
Once the MCP server is added, I start Claude and run a /mcp. I see my server get connected.
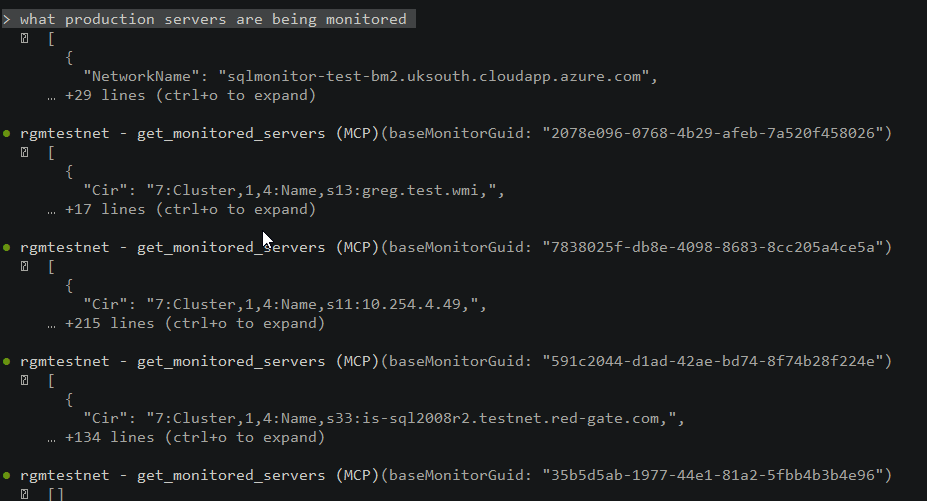
There are a number of tools, which have grown since I started testing. I don’t have a complete list and anything I put here will be out of date in a week, so I won’t bother. In any case, I’ll ask for the production servers. I can see the various base monitors being queried. This is slower than almost any customer, since we have more BMs than most people here. Most have 1-2 at most.
Note: I did get asked for permission a few times before the tools were accessed. Since all MCP stuff is read-only now, I just granted permission for all sessions.
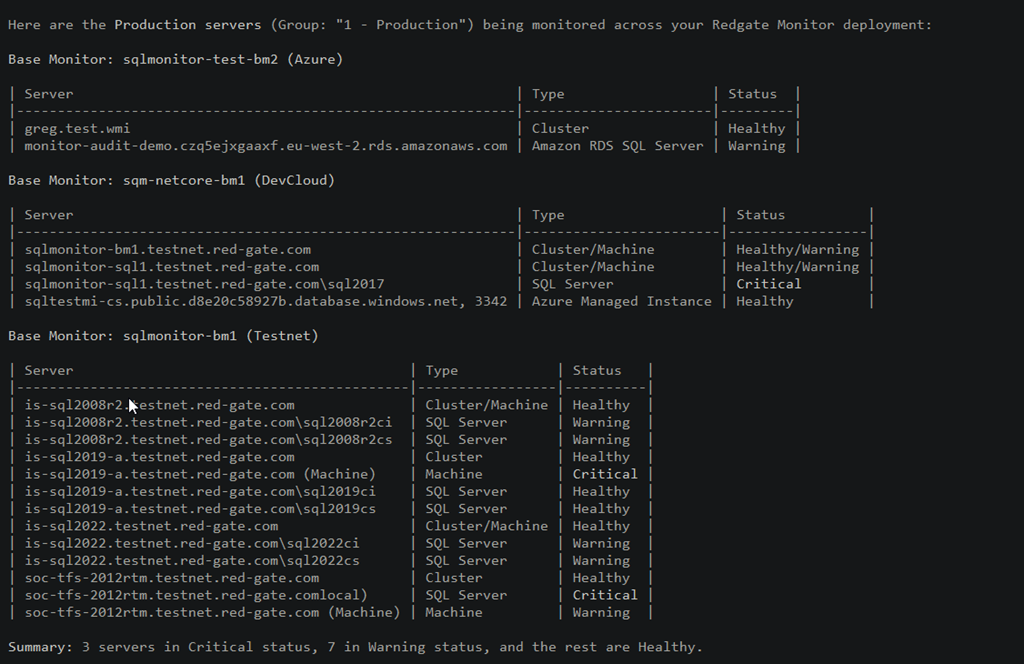
Here are the results. Note the summary at the bottom.
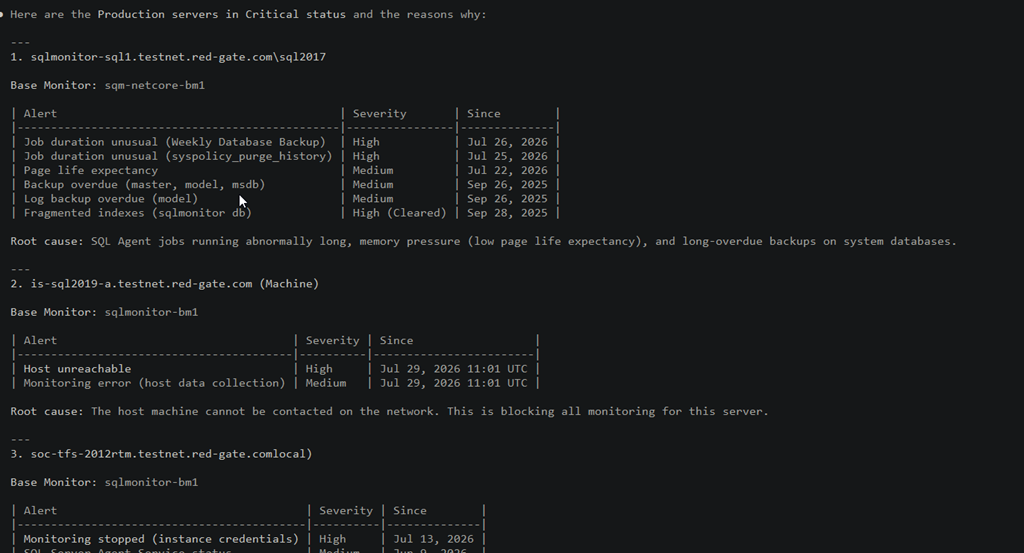
I next asked this: which servers are in critical status and why. The Claude LLM interprets this and starts querying the Redgate Monitor server, using the token for security, and the tools, which are really the API of things that can be run.
The results I got were what you see below. The LLM had to run a bunch of queries to get results and the read in those results and interpret them. In this case, there were a lot of different queries of tools to look for data. This probably took a minute or two, but it feels long while watching the screen.
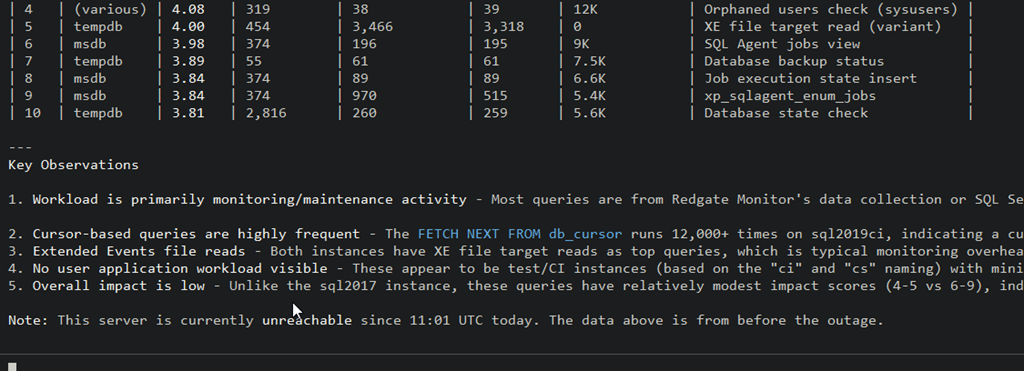
I next asked about queries on an instance. I don’t know these servers that well, but I know there are workloads on some to simulate what clients see. I decided to ask about one of the 2019 instances in production. In this case, I got asked for permission for a new tool (I hadn’t run the top queries tool) and then the agent went to work. You can see the tool usage and results. In this case, the system was down when I ran this, and it let me know this was from before the outage.
At the bottom, there are some observations, which can be useful. I’ve got cursors running, XEvents, etc. Helpful to look at this for a system I don’t spend a lot of time examining.
Ultimately the MCP server is a way for you to use tools you use already, but allow them to query the data in Redgate Monitor.
I’m excited to see where this can go, and how it can help customers interpret all the data collected by Redgate Monitor and more easily summarize it. This will be useful to some, though others of you might not like MCP access and instead stick with the internal AI tools.
It’s up to you, but we are giving you the choice to work as you wish.
Summary
The Redgate Monitor MCP server is in preview as of July 2026. I tried to give you a short sense of how you can use this to query Redgate Monitor and keep an eye on your systems. There are lots of ways to work, and I’ll try to give some guidance on specific things over time, but for now this gives you a sense of how MCP works.
I’ll do future posts that cover the config and help you get testing in your own environment.
Redgate Monitor continues to grow and advance and MCP capabilities are a great way to start using AI to help manage a large database estate, with your own AI resources.
Redgate Monitor is a world-class monitoring solution for your database estate. Download a trial today and see how it can help you manage your estate more efficiently.
We are product focused at Redgate Software. Here is another of our values that focused on this:
The text on the next page is:
Shipping something amazing is better than creating something average and to budget and on time. We cannot market, sell, manage or account our way to success.
We have tried to do that. I’ve used many of our products before coming to work for Redgate. My former partners at SQL Server Central used them extensively as well. Since I have been an employee, I’ve worked with a lot of customers who constantly find value in our products.
I think we’ve succeeded, and I think that us trying to build useful software is what has helped. My fellow advocates and I constantly try to bring the voice of the customer to Redgate so that our engineers better understand your challenges. This helps them build things that are useful.
I have a copy of the Book of Redgate from 2010. This was a book we produced internally about the company after 10 years in existence. At that time, I’d been there for about 3 years, and it was interesting to learn a some things about the company. This series of posts looks back at the Book of Redgate 15 years later.
At the Redgate Summits this year, we’ve highlighted a few things in the Flyway solution that help developers improve their ability to get work done safely and quickly. While lots of developers are moving to automated systems and catching issues in pipelines, plenty of you are still working in an IDE.
This post looks at the new code analysis feature in Flyway Desktop that can help warn you of potential issues before you create that PR.
I’ve been working with Flyway and Flyway Desktop and helping customers improve their database development. This series looks at some tips I’ve gotten along the way.
Generating Good Migration Scripts
Flyway gives you determinism and consistent scripting when you generate migration scripts. Plenty of developers still do this manually, often after a lot of work and testing is done on the schema model. Once you’re sure of the changes you want to make, you can select those changes to include in a deployment.
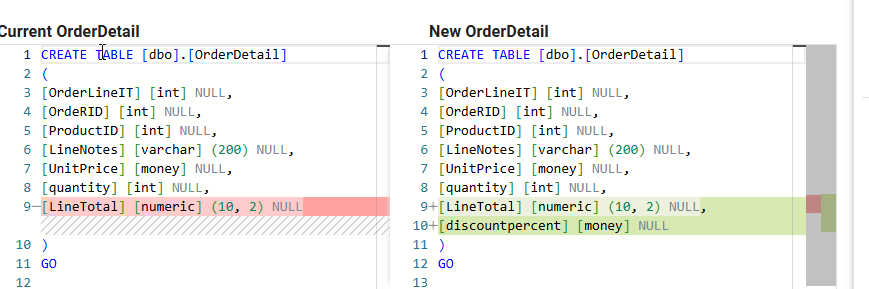
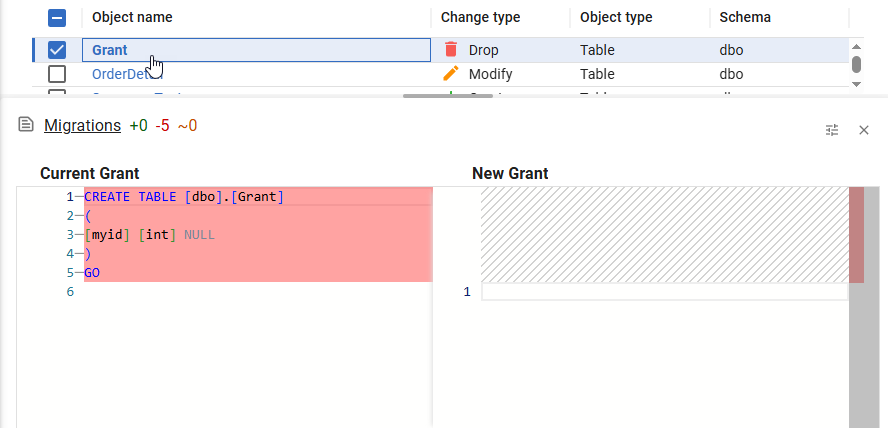
As you can see below, I have a lot of changes, but I want to just pick one to put into a deployment.
If I click on the change, you will see that this is simply adding a new column, something developers do all the time. I’ll select that and click “Generate Migrations”
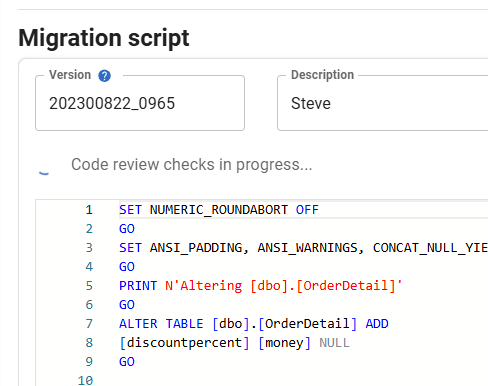
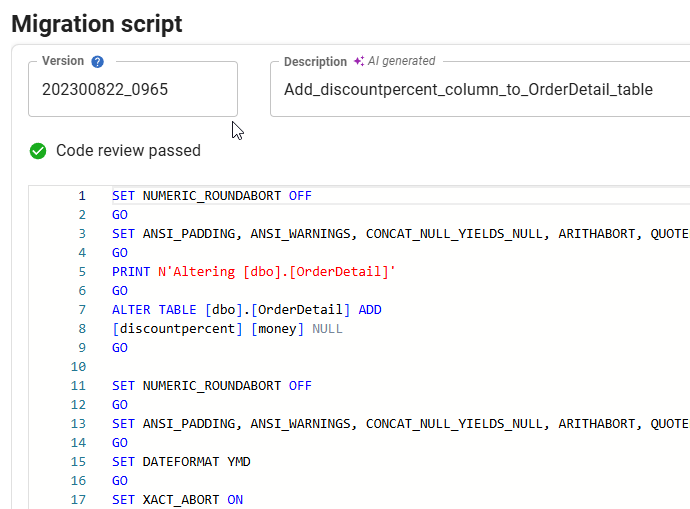
When the tab changes, the default screen shows the next numbered migration script, based on my patterns and a default description of my name. Note that there is also a “Code review checks in progress” item to the left, which is running as the code is generated.
Once this completes, you can see my code rules passed, and the Flyway AI has generated a better description of the changes than I might have typed in.
There are a number of rules by default, and these are run when the migration script is generated. You can change, add, disable, customize, etc. for these rules as appropriate for your project.
Let’s go back and select a different change. In this case, I’m selecting the “Grant” table and dropping it. It’s in the current view of the db, but not the next one.
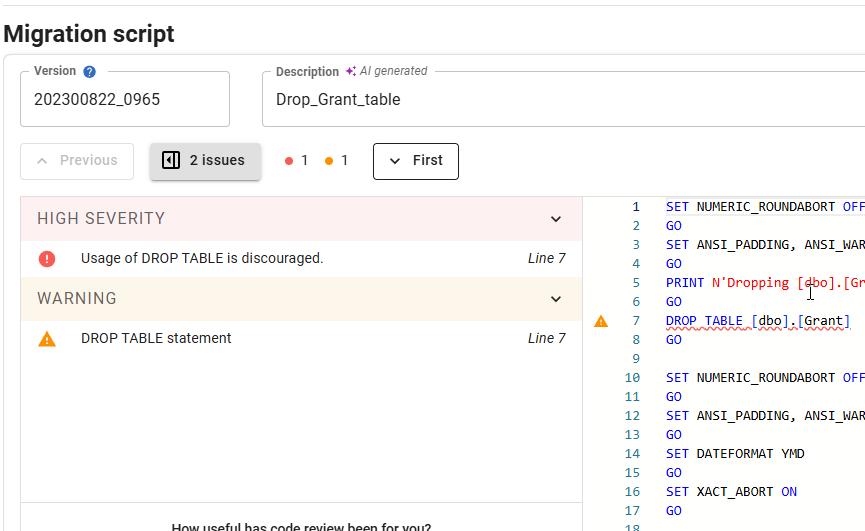
When I click Generate Migrations and go to the next tab, you can see that the code review shows me two things: a high severity error and a warning. These are summarized at the top next to the “2 issues” button (which hides or reveals the details) as dots. If I had a lot of issues, and some of you do, this gives me a quick look.
Below that I get the details. Both of these are for the same line, which is highlighted in the middle by a triangle next to that line.
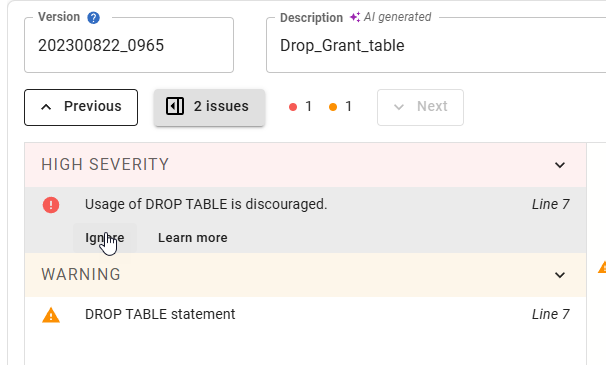
If I click the High Severity item, I have the options to learn more, which links to the actual rule on the Redgate documentation site. Or I can ignore it. This allows me to comment in the code to not run this review again.
For the warning, since this wouldn’t stop a deployment anyway, I just have a Learn more link.
There are certainly times this might be the desired action, so I like the ignore button. However, much of the time developers might be making changes to objects and not thinking about potential future issues. Code review here catches things early, before others have to get involved, and helps educate developers about the styles and standards we want enforced in our projects.
If you work with Flyway, update your desktop and give it a try. We would love to hear your feedback.
Flyway is an incredible way of deploying changes from one database to another, and now includes both migration-based and state-based deployments. You get the flexibility you need to control database changes in your environment. If you’ve never used it, give it a try today. It works for SQL Server, Oracle, PostgreSQL and nearly 50 other platforms.