Tag: syndicated

  • Exporting SQL Data Compare Results to Excel

    I had someone ask recently about getting SQL Data Compare results in Excel. It’s easy to do and this post looks at the process.

    Exporting a Comparison

    I won’t go into the details of making a comparison. I have another post that looks at this with joins, but the tool is fairly intuitive (ingeniously simple) to use.

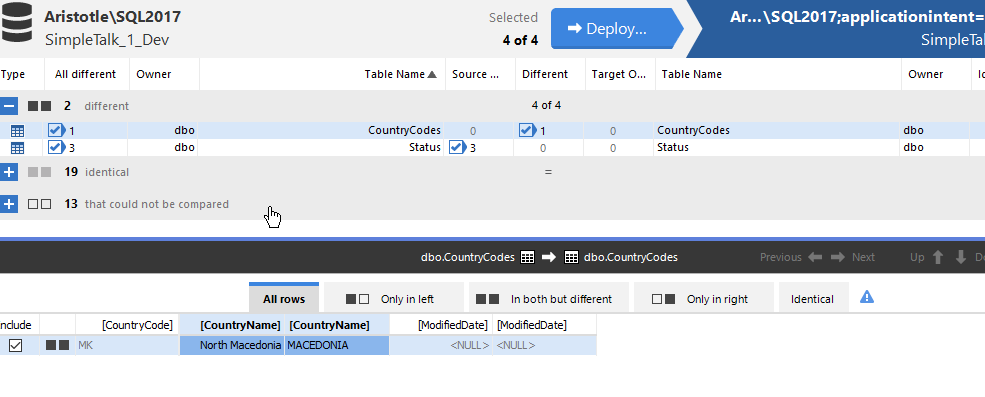
    Once you have a comparison, you should see something like this image. Here I have two tables that are different (I selected all tables). The first, dbo.CountryCodes, has a difference in a row, different values in the name.
    2023-04-14 13_47_56-SQL Data Compare - E__Documents_SQL Data Compare_SharedProjects_(local)_SQL2017.

    The second, dbo.Status, has some rows in the source (left) that are not in the target.

    2023-04-14 13_48_02-SQL Data Compare - E__Documents_SQL Data Compare_SharedProjects_(local)_SQL2017.

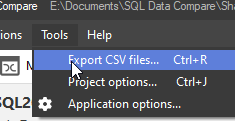
    To export these results, I use the Tools menu. There is an option you can see below:
    2023-04-14 13_48_08-

    Once I pick this, I get a dialog with options. I can pick certain tables, or all. The defaults are all tables, and only show differences. Note the identical button is not selected.
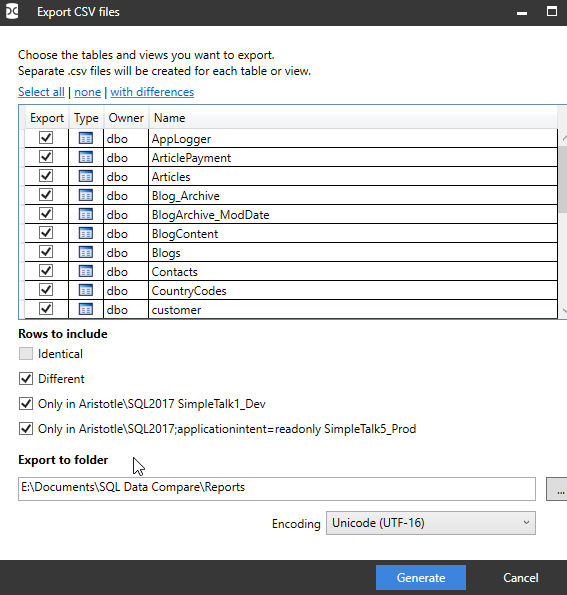
    2023-04-14 13_48_17-Export CSV files

    If I open the folder in the dialog above (after clicking Generate), I see my files. There are separate files for each table and one with a summary.

    2023-04-14 13_48_24-Reports

    If I double click the dbo.CountryCodes.csv file, Excel opens, but not the way I like it. I see this:

    2023-04-14 13_58_46-dbo.CountryCodes.csv - Excel

    However, if I File | Open the file, I get the wizard for delimited files.
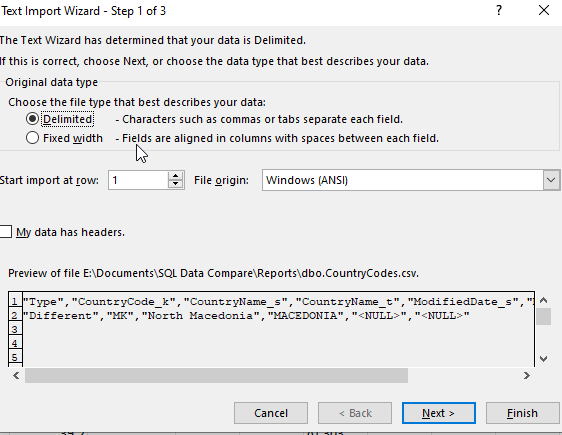
    2023-04-14 13_59_00-Expenses 2023.xlsx - Excel

    When I go to the second page and click “comma” as the delimiter, I see a better preview.
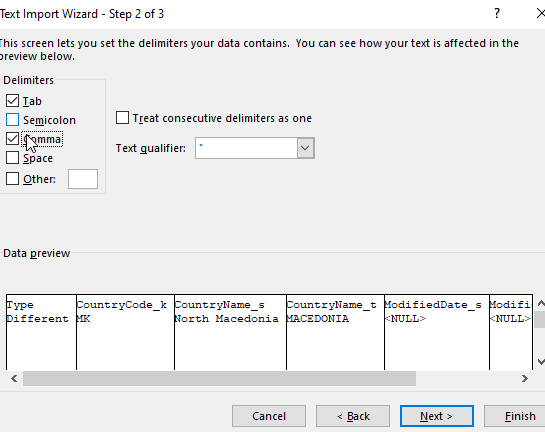
    2023-04-14 13_59_05-Text Import Wizard - Step 2 of 3

    I can finish this and I see my data. In this case, the first column lets me know this is changed data that has the same row with the same PK in both databases.

    2023-04-14 13_59_22-dbo.CountryCodes.csv - Excel

    Similarly, I get open the Status table file and see this. Here the first column lets me know this data is only in the first database, the source or left database, that I set in my SQL Data Compare project.

    2023-04-14 13_59_50-dbo.Status.csv - Excel

    The summary also needs the same open process and this shows me all tables, with lots of zeros. However, for my two tables, you can see there is 1 row noted in the Different column for CountryCodes and 3 rows only in the source (SimpleTalk_1_Dev) database.

    2023-04-14 14_00_35-Results Summary.csv - Excel

    I can then save these in Excel format if I like and send them around to colleagues.

    Summary

    You’ve seen how you can review SQL Data Compare results in Excel. I don’t know if your Excel will open the CSV with values in separate columns, or if you need to perform a File | Open as I did.

    This is useful for sending to a business user that might need to make decisions about what data needs to be synched where. The hardest part here is explaining the _s and _t names for source and target.

    SQL Data Compare is very handy for single GB data sets to compare. I wouldn’t recommend this for > 10GB, but under that, with good hardware, you should have success comparing tables or views.

    If you’ve never tried it, download an evaluation today.
  • Flyway Desktop PoC–Adding a Shadow and Baseline Script

    In the last post, I created a baseline marker for Flyway in each database. This set the version in the dev and QA databases to v1. However, I also need a baseline script, at least the tool asks for one, so this is the process if you have objects in your production or other downstream databases.

    I’ll do this for SQL Server and then PostgreSQL.

    Why do this?

    The main reason to create a baseline script is to note which objects already exist in production. For these objects, I don’t want to track these are changes in their current form.

    For example, if I already have a CountryCodes table in production, when I create a project, I want to tell Flyway Desktop that this table exists in production, so if the dev version matches, don’t add this to scripts. If it doesn’t, then I’ve done something in development and need an ALTER script deployed to prod.

    What was the Other Baseline?

    The first baseline in this post, is a version marker. I hate that this is the case, but both Flyway (pre-Redgate) and Flyway Desktop (evolved from SQL Change Automation), had the concept of a baseline, but these were somewhat different things.

    Flyway Baseline – The initial version of the database. Don’t deploy any scripts that are <= to this version.

    Flyway Desktop Baseline – A script that has the structure and code of all objects that exist in the target database(s).

    We can create a baseline script for Flyway, which looks for a B script, but the baseline command expects that you create this script manually. This is used to populate a new database with the baseline migration script prior to running all other scripts.

    Setting up the Baseline Script

    Flyway Desktop makes it easy to create a baseline script, and in fact, prompts you to do so.

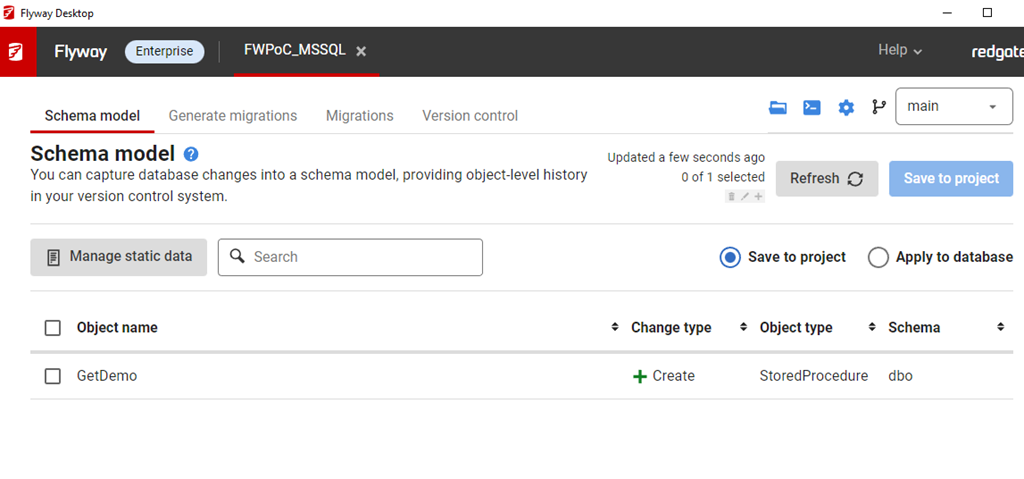
    In my project, if I go to the Schema Model (first) tab, I see there is an object in Development. This was the table I created when I set up the database. The goal is to get this table to other environments.

    2023-04-04 16_10_58-Flyway Desktop

    This table doesn’t exist in QA. I do have the flyway_schema_history table, which was the result of the baseline command.

    2023-04-04 16_15_58-SQLQuery4.sql - ARISTOTLE_SQL2022.FWPoc_1_Dev (ARISTOTLE_Steve (77))_ - Microsof

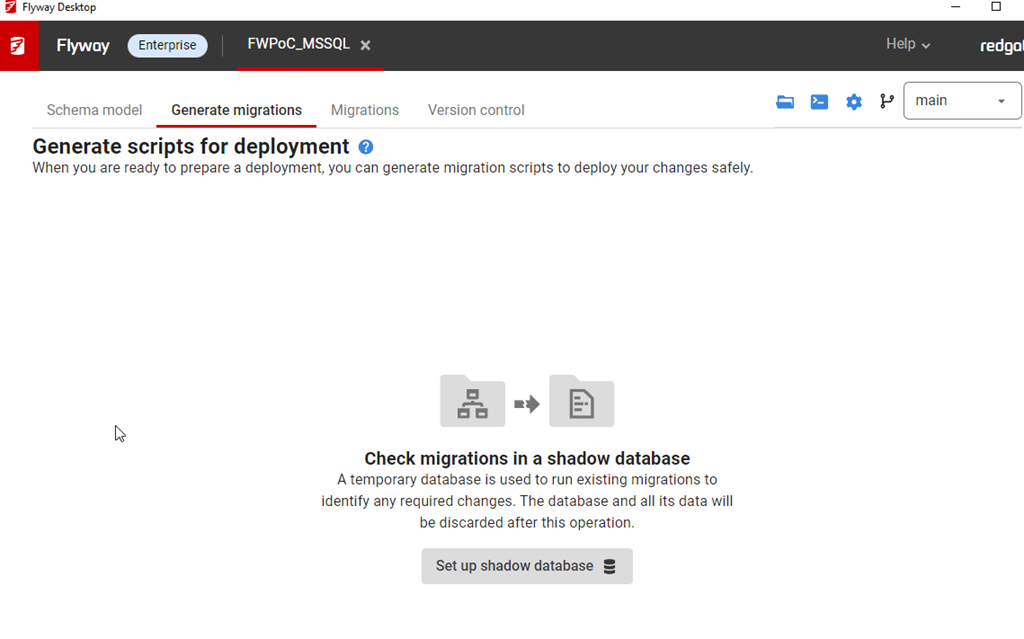
    If I go to the Generate Migrations (second) tab, I see this. The first thing that the tool wants is a Shadow database.

    2023-04-04 16_12_55-Flyway Desktop

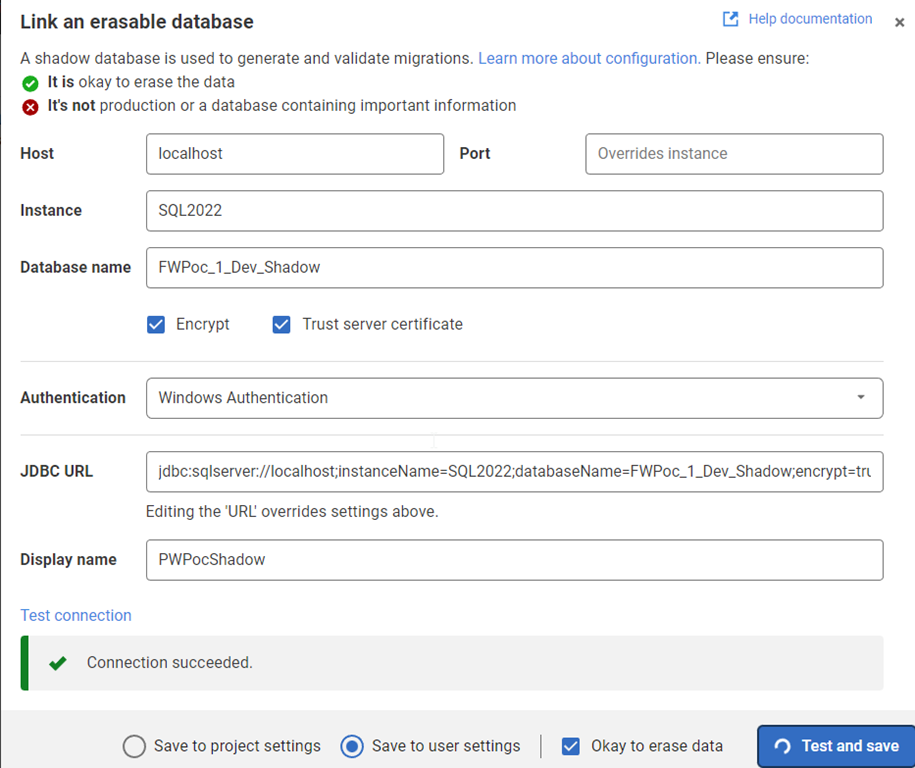
    The shadow is essentially a development V-1 (v minus one) version. This is where I test all migrations, compare the state with development, and then determine what’s changed. This is just a regular database, but I create this outside of Flyway Desktop. For me, I created a database (FWPoc_1_Dev_Shadow) and then clicked Set up shadow database to get this dialog. You can name this anything.

    I enter details, and test the connection before saving this. In general, this ought to be saved to my user settings as I’ll have my own shadow different from other developers. I DO NEED to click the “ok to erase data” box.

    2023-04-04 16_14_09-Flyway Desktop

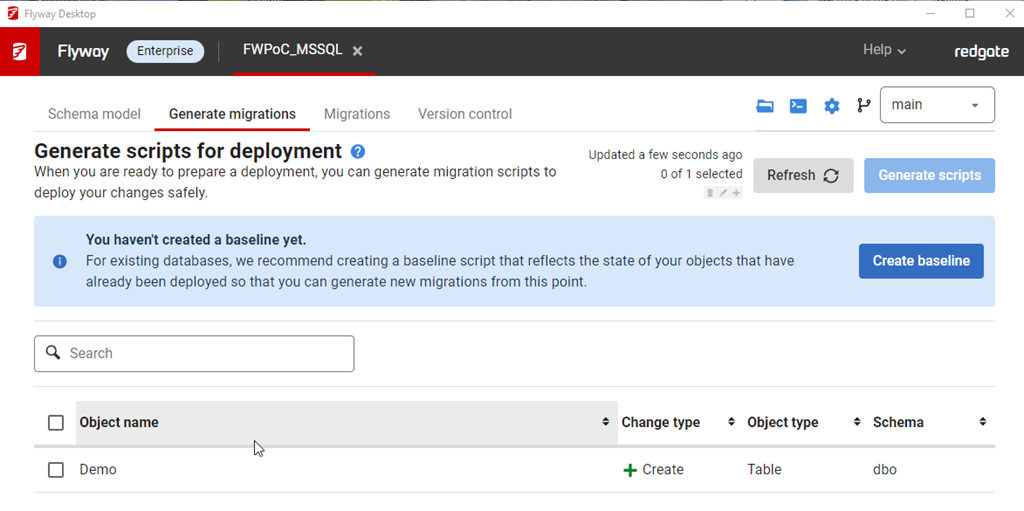
    Once this is done, I now see another prompt on the Generate Migrations tab. Now I need a baseline script. I don’t have anything, but I will click the button.

    2023-04-04 16_14_28-Flyway Desktop

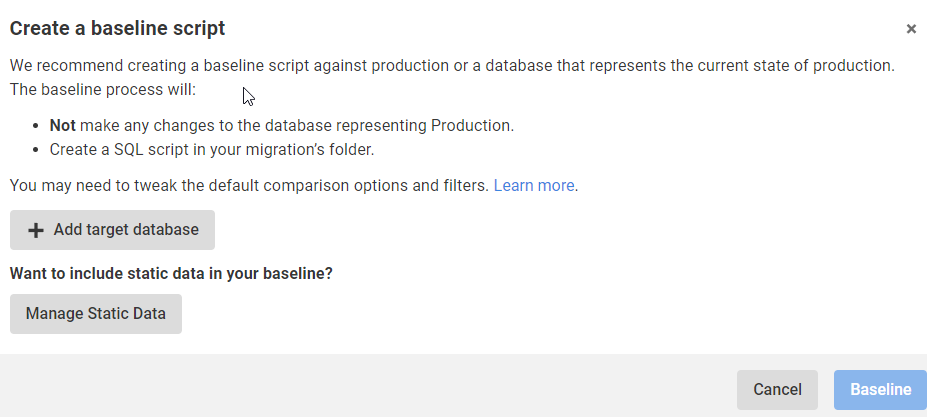
    This gives me a dialog to pick a target database. This target is used to get the initial set of objects to populate in the baseline script. You can use production or a copy (recommended) as the target database.

    2023-04-04 16_14_41-Flyway Desktop

    My QA is the same as prod, so I add that with the proper connection string and then I see the target here for the Baseline. I am ignoring static (or lookup/reference data for now). I’ll click the Baseline button.

    2023-04-04 16_15_25-Flyway Desktop

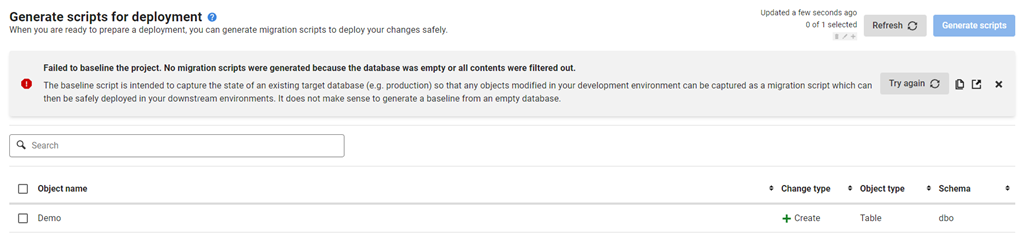
    This runs and … nothing.

    Which makes sense, as there is nothing in my target database. I actually get an error after this, which tells me that it doesn’t make sense to baseline an empty database.

    2023-04-10 12_38_51-Flyway Desktop

    I wish that were surfaced earlier. In any case, if I close this, I get the same image above, saying I don’t have a baseline. For now, I’ll ignore that.

    Summary

    Not much happened in this post. I added a shadow database, which I’ll use to generate scripts. I tried to baseline, but that errored, as it should. I really don’t need a baseline, so I’ll come back to this later in another format.

    For now, I’ve advanced the SQL Server project. I’ll actually repeat these steps for the PostgreSQL one, but it’s really creating a new database for the shadow and setting a connections string. Everything else looks the same.

    The next post will actually generate a script and deploy this to QA.

  • Creating a Simple Graph in RedisGraph

    I delivered a session on graph databases, and in it I used RedisGraph to show how you can work with graph data on that platform. This blog shows a basic creation of a graph in RedisGraph. This isn’t intended to be a comprehensive post, but more a basic look at the code to work with graphs.

    Adding Data

    I connect to Redis with the command line. If you don’t know how to do that, I covered this in another post. Once I’m connected, I can run this code to create a graph and a node:

    GRAPH.QUERY Northwind "CREATE (:employee {employeeID: 10, firstName:'Steve', title:'President'})-[:REPORTS_TO]->(:employee {employeeID: 11, firstName:'Tia', title:'CEO'})"

    This will create a graph, two nodes, and one edge between them. This starts with GRAPH.QUERY, which let’s Redis know this is a graph query. I then give the name of the graph, which is Northwind since I based this on the Northwind dataset.

    Next I use a Cyper language CREATE and enter the data in what is very similar to JSON. I label a node (employee), add the properties and values (employeeID and firstName with 10 and Steve as values).

    I use the square brackets with the edge name in between this and another node. This will get me the results shown below. You can see that one label, two nodes, six properties, and 1 relationship created.

    2023-03-24 15_34_05-cmd - redis-cli

    I can get the employee nodes with this code:

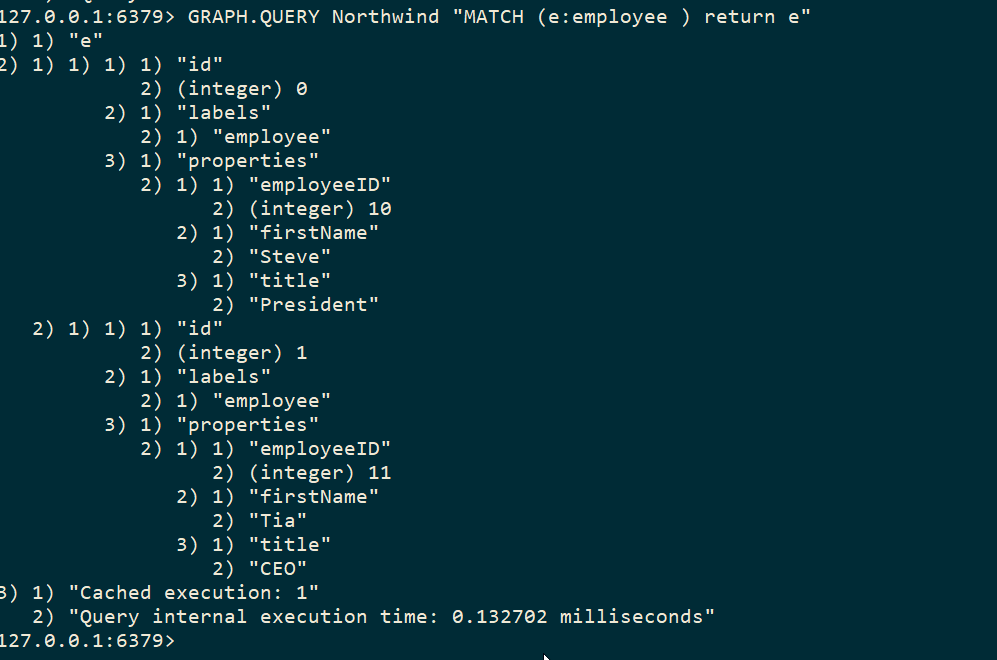
    GRAPH.QUERY Northwind "MATCH (e:employee ) return e"

    This returns the two nodes.

    2023-03-24 15_37_23-cmd - redis-cli

    If I want to see the relationship, I need to ask for that with this code:

    GRAPH.QUERY Northwind "MATCH (e:employee)<-[:REPORTS_TO]-(sub) RETURN sub.firstName as employee, e.firstName as manager"

    This returns my graph as a series of data elements.

    2023-03-24 15_37_23-cmd - redis-cli

    Tada!

    There is more you can do and certainly you can create more complex (or larger) graphs in Redis. The drivers from various languages should return JSON to you that you can deserialize and visualize or otherwise process results.

    A lot of this is basic, but if you want to experiment with Redisgraph,  a container and the CLI is a good way to get started.

  • Dropping Career Goals for Q2

    I set goals at the beginning of 2023 for Q1. I didn’t do well, as my evaluation earlier this week has a D for my efforts.

    I’m re-evaluating things, and for now, I’ve decided not to set more goals for the time being.

    Why?

    One of the things I end my career presentations with is this: we work to live, not live to work. Find balance in your life, between your career and life.

    I truly believe that, and as I re-evaluated myself last week, I realized that I am out of balance. There have been some stressful things in life that have been hard on me, but more than the actual thing, it’s had an impact on my mental health. I’ve been a bit drained, so I haven’t wanted to take time to focus, preferring to relax a bit more with my wife, guitar, or a good book.

    I started to recognize this when I did my Feb update, but thought I could push through. I didn’t, or couldn’t, and while I appreciate the optimism, I realize that I don’t want to ignore the additional stress in my life.

    A Deliberate Pause

    I don’t want to let goals go, but I am going to ignore them for Q2 and focus on being kind to myself and recognizing I need balance here. I’ll revisit this in late June and see how I am doing then.