Author: way0utwest

  • OT: The Next STEM Generation

    Now, it’s not a Star Trek reference. I’m actually breaking a bit from life this weekend to try and move my son forward in life. We’ve arranged a tour of the University of Colorado – Boulder campus, specifically with an eye on the aeronautical engineering program. He’s interested in that area, and we are trying to give him options for university next year.

    I’ve hoped my kids would enjoy computers, and they do, but not like I enjoy them. They aren’t interested in building things with computers. They just want computers to do their bidding.

    My oldest wasn’t very interested in computers at all, though I was able to teach him some SQL for his college GIS class the last year. We worked on understanding how to query data, but he never really understood the concepts well and needed help regularly. However he did learn enough to be able to alter my queries to meet the changing needs of different data sets.

    My middle son is a math/science whiz, and spent a few weeks one summer learning programming at a camp. He built a few small applications, but beyond that he wasn’t interested in learning more. While he like chemistry and aeronautics, programming seems silly to him.

    My daughter is the most savvy in moving data around, building web pages for visualizations and working across platforms. She seamlessly will use Windows, OSX, iOS, and Android on any given day across her four devices without blinking. She moves and uses data all the time, but hasn’t ever wanted to do more. She has done well in math and science, and is on pace to get to calculus her senior year of high school.

    I do want to encourage kids to try STEM subjects, and feel comfortable. My daughter certainly has felt pressure, and has female friends that feel the same pressure, to not work in STEM fields. I’d like to eliminate that, but more importantly, I want everyone to try the topics and really get a chance to experiment.

    If you don’t like STEM topics, that’s fine. Find another area you do enjoy more, but at least give STEM a try.
  • Maturing Your Database Development Process–Version Control

    At Redgate Software, we have a progression of the stages of a database development pipeline. These are the various ways in which you can better engineer your database development to ensure smoother releases to production, with less issues. There are five stages:

    • Manual (S0)
    • Source Control (S1)
    • Continuous Integration (S2)
    • Release Management (S3)
    • Monitoring (S4)

    As I travel around, speaking on these topics, I find many people working in development stops that are really at the S0 level.

    For databases, that is. For their .NET or Java or PHP software, quite a few are at S2, and maybe working towards S3 in many projects.

    That’s a disconnect, and it’s one that we’d like to see changed at Redgate. Certainly we can help and we’d like you to use our products, but more, we want to see better development all around.

    We’re Trying to Help New York City

    In a few weeks, on August 27, 2015, I’ll be in New York to help teach our Database Source Control workshop. Ike Ellis (Crafting Bytes) is teaching the class, and I’ll be there to support him and run the labs. This is a course that Grant Fritchey, myself, and a few others at Redgate Software have built.

    This is the chance to learn how your organization can implement version control for your database, just as most of your developers probably already have for the other software you write.

    We’ll cover setting up Source Control, deploying changes from versions, branching, merging, and more. This is a great hands-on introduction to stabilizing your database development. We’ll provide a VM with labs that you will actually complete.

    We’ve put this first step to building a DLM pipeline on sale for $100. If you’re close to NYC, consider taking a day off and joining us at the Microsoft office in Manhattan for a little database education.

    If you can’t make this workshop, look through our schedule and join us somewhere at a future time.

  • Loading XML Data–CONVERT Option 2

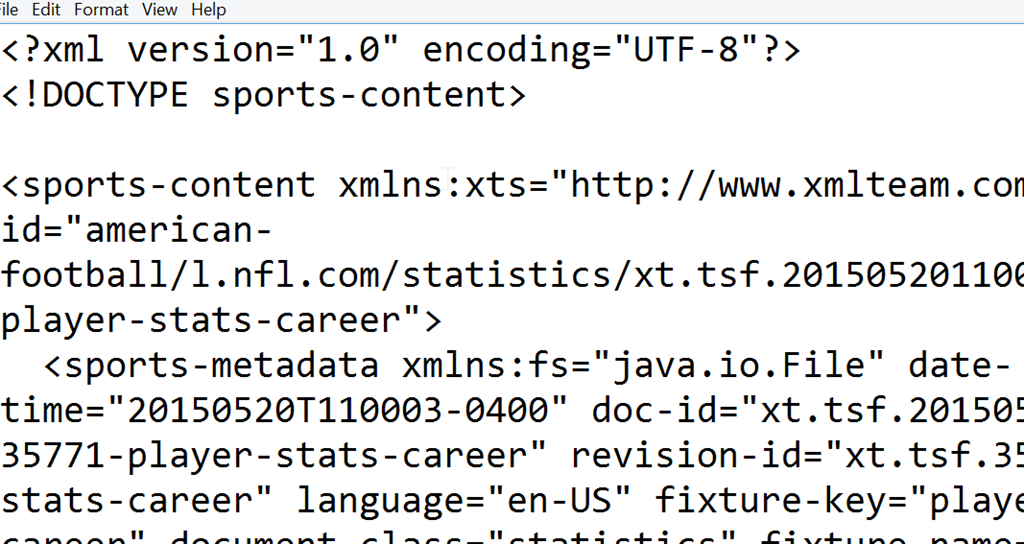
    I was playing around with some XML lately, and had to load a file that looked like this::

    2015-07-22 14_40_59-mathis.xml - Notepad

    I ran a simple query, one that used the OPENROWSET and a CONVERT to load the data.

    WITH XmlFile (Contents) AS (
    SELECT CONVERT (XML, BulkColumn) 
    FROM OPENROWSET (BULK 'C:\mathis.xml', SINGLE_BLOB) AS XmlData
    )
    SELECT *
    FROM   XmlFile
    GO
    

    However, that didn’t work. I received this message in SSMS.

    Msg 6359, Level 16, State 1, Line 1

    Parsing XML with internal subset DTDs not allowed. Use CONVERT with style option 2 to enable limited internal subset DTD support.

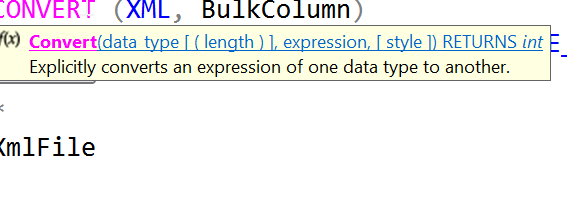
    Hmmm. That seems to make sense. Let’s add an option to CONVERT of 2. I’ve assumed the last parameter is the one mentioned, as with date conversions, and added that. I can hover with SQL Prompt and see that.

    2015-07-22 14_43_13-SQLQuery1.sql - ARISTOTLE.sandbox (ARISTOTLE_Steve (71))_ - Microsoft SQL Server

    Let’s change the code:

    WITH XmlFile (Contents) AS (
    SELECT CONVERT (XML, BulkColumn,2) 
    FROM OPENROWSET (BULK 'C:\mathis.xml', SINGLE_BLOB) AS XmlData
    )
    SELECT *
    FROM   XmlFile
    GO
    

    That works.

    Why?

    If you go to the BOL page for CAST and CONVERT, you will find an XML styles section. There are possible values of 0 (default), 1, 2, and 3. In this case, the 2 enables an internal DTD processing, which basically uses a default document of sorts for parsing the XML. No external DTD is needed and this is treated as a standalone document.

    I am not an XML expert, but I’m guessing here that I’ve included a document that doesn’t conform to some specification and the additional style parameter allows SQL Server to ignore some of what’s there.

    If anyone knows more, I would like to better understand how this works.

  • Amateur Data Analysis

    What’s a good way to analyze data? How do you know if you’re actually looking at data in a way that provides a valid analysis? It’s entirely possible to statistically look at a set of data, run some aggregates, build graphs, and come to a conclusion (or recommendation) that would hurt your business rather than help it.

    In academia, many people have their analysis and conclusions reviewed by their peers. Over time, many of the people analyzing data learn from others and start to build skills in how to look at data sets and consider the interpretations that seem to be more valid. Of course plenty of mistakes are still made, but I think the quality of analysis is pretty good overall.

    In business we are often working in silos, in semi-secretive ways where our analysis might not be questioned or reviewed. How do we build some skills? One way might be to do what Dev Nambi did, publishing an analysis of college costs and including his thoughts on what the data shows. You could also look at this crime report from Samuel Vanga.

    I thought this was a great example of taking a set of data and trying to make sense of it in a variety of ways. While you might have your own thoughts on what conclusions and implications to draw (leave comments about that for Dev on his blog), I think this is an interesting way to approach analysis of a set of data. Many of us could experiment with different visualizations and the analysis of this (or other data), and get comments on our approach.

    For example, I find the stacked bar graphs more difficult to understand than a series of line graphs. I also would like a bit more context in what the author sees as an analysis of each graph, but those are my views. Perhaps if I wrote an analysis of some set of data, I’d find others would let me know the ways in which I present my findings are flawed or difficult to understand.

    I’d encourage you to practice building analysis, along with other skills you find useful in your job. While most of you can’t use business data on your own blog, perhaps you can find a data set that’s interesting to you and dig in to see what information you can extract and present.

    Steve Jones