Tag: Redgate Monitor

  • The Single Pane of Glass

    One of the things that I’ve seen talked about quite in the DevOps movement is a single pane of glass. That phrase seems to be in use to describe a way of quickly understanding the state of your environment. It could be the view of the software versions deployed in environments throughout the development process or the status and capabilities of your infrastructure. In either case, it’s a holistic view of your portion of the organization.

    I don’t think this is much different from the idea of a global dashboard that might be produced for business people. I’ve seen no shortage of those during my career. Certainly lots of business intelligence projects have been based on the idea of a single view of data that provides insight and assists decision making. Those ideas have been adopted by plenty of organizations that are moving to a DevOps process for software development.

    I’m wondering if any of you have a dashboard for your particular job? This could be in infrastructure as a DBA, where you have a single view of your database servers, maybe status and alerts? Perhaps you just a monitoring system like SQL Monitor to keep track of important data related to all the instances under your responsibility. Perhaps you have custom information important for your organization such as the flow of data in ETL processes, numbers of transactions, or some other measures to measure health or performance.

    Maybe you’re a developer that wants to know the status of all builds for the various projects under active development. As teams look to produce more reliable software, they often want to know the where their changes are deployed, if the code passes all tests, and even which work items are in which states. Azure Boards or DLM Dashboard are examples of how teams keep track of their responsibilities.

    There are any number of ways that organizations can keep an eye on the state of their systems, but I do think that any high performing group will have some way of measuring their work. After all, if you don’t know the state of your system, how can you determine if you’re getting better or worse.

    Steve Jones

    The Voice of the DBA Podcast

    Listen to the MP3 Audio ( 3.0MB) podcast or subscribe to the feed at iTunes and Libsyn.

  • Custom Data Purging in SQL Monitor

    In talking to a customer recently, they were worried about the amount of data kept by SQL Monitor. That’s a fair concern as monitoring a large number of servers can result in lots of data.

    As an aside, data management is one of the reasons that I’d always want to buy a monitoring tool from a vendor. Most people don’t get this right and it’s a pain to deal with. I’d like you to look at SQL Monitor, but if it doesn’t work for you, look at our competitors. More people need monitoring on their systems.

    In any case, this customer wanted to ensure some data was removed, but not other data. Their concern was that things like performance data or storage data might be needed for a long time while alert data or top queries might not. In other words, customized data management is needed.

    I posted the suggestion in the SQL Monitor Slack channel, asking the developers if they were considering it. In about 5-10 minutes, I got this link: https://monitor.red-gate.com/Configuration/Purging

     2018-08-23 12_15_16-Configuration _ Data purging

    Shazam! They’d already done it.

    Actually, they’ve released this to frequent updaters, but in an upcoming release, this will be the default. You’ll be able to customize how long you want to keep each kind of data. Not by machine (yet), but if you need that, let us know.

    SQL Monitor continues to amaze me with their progress. If you want to get an idea of how it works, check out monitor.red-gate.com, our demo site, where we monitor some real servers at Redgate, including the SQLServerCentral database instances.

    And if you want it in your enterprise, download a trial today.

  • The New Global Dashboard

    Redgate recently released SQL Monitor 5.2, which is the latest upgrade to our monitoring/alerting/troubleshooting product for DBAs. This was the big change that the team has spent a lot of time developing and refining. It’s been available for a few weeks as a hidden URL, but with 5.2, this becomes the default main screen for SQL Monitor.

    I think it’s a good move forward. In general, I don’t like things moving around physically in applications, as I get used to them being in a certain spot, or I expect them. However in this case, it makes sense.

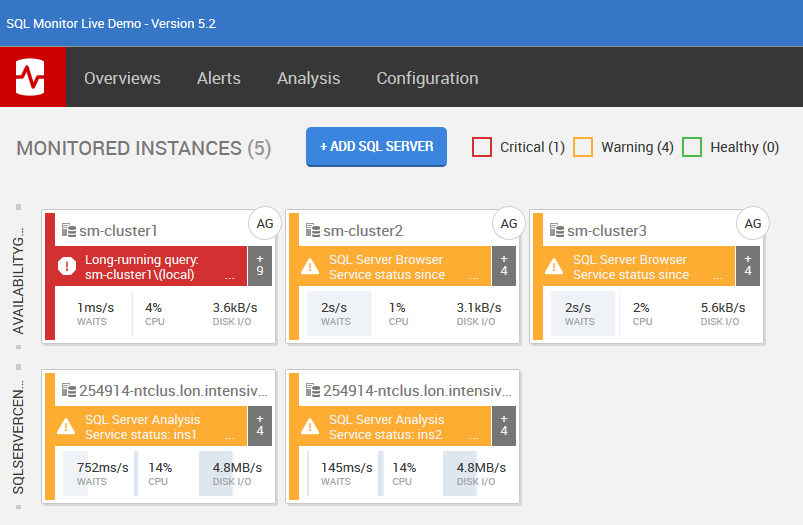
    In a dashboard for monitoring and alerting, you want to know what’s broken. Having a list of 20 servers at the top, and 1 broken one potentially “beneath the fold” (in newspaper parlance) and requiring scrolling would be bad. As a DBA, I’d want to see those items that are problematic. When I look at the monitor.red-gate.com site, I see:

    2016-05-12 08_39_11-Global Dashboard

    The cluster has a long running query, which is an active, high priority alert. If I were to clear this, along with the other active alerts, this “card” would move to the end, and the sm-cluster2 item would take the top left spot.

    Note there are options to configure what is a high or low priority, and even pin specific servers at the top, but the general behavior is to let you know what’s broken now.

    There’s one other cool feature in this. If I have a high level alert, like a machine unreachable, and the alert clears itself (the machine reboots), I may see the machine as “green” on the dashboard when I login. This is because current alerts are shown, not historical ones. I can still get the historical data, but the intention is to make this a responsive tool for right now, not last night.

    I think this is a great change, and I’m excited to see how well it works in practice as customers roll this out.

  • Checking Baselines with SQL Monitor

    We’ve got a demo of SQL Monitor available that takes data from the actual SQLServerCentral systems and presents it publicly. The data is slightly delayed, but it’s the real data and it shows the performance of our system.

    I actually use this at times when the site isn’t responding well. It’s quicker for me to hit monitor.red-gate.com than log into VPN and check the real instance.

    I was reading a report for a customer recently and they mentioned they used the baseline feature to track performance of the system when they make changes, using this to decide if they think the changes were positive or negative.

    Note: they rarely roll back, instead using this data to determine if they need to dig into more specifics and then create a new deployment (roll forward) that can address issues.

    Baselines

    There has been a lot written about baselines, but essentially these are a way of capturing what is “normal” for your system. If current performance deviates from normal, you might have cause for concern.

    Of course, this is a gross way of looking at a system and you have to apply some of your own knowledge to determine if you have issues, or some transient workload is altering performance during your sample period.

    You can see a demo of baselines online and play with the ranges. It looks similar to this image below, in which case I can see the last 24 hours of my CPU time, and then compare that with the 24 hours before that.

    baseline

    Using this type of diagram, I can quickly visualize issues that might be occurring without resorting to complex analysis.

    This doesn’t give me the exact problem. I’d still need to dig into the code being run, look at execution plans and other detailed data (much of which I can get from SQL Monitor as well), but this does let me make an initial judgment on where to focus my time.

    I would highly encourage you to run, keep, and update baselines on your system. At the very least, you should have an idea of what types of performance should exist on critical systems.