Tag: Redgate Monitor

  • Database Search in SQL Monitor

    I learned something new recently. I can search in SQL Monitor for a database name, not just a server or instance name.

    I tested this over at monitor.red-gate.com recently after a developer mentioned this feature. If you look at the Global Dashboard, there are a lot of machines. You can see 28 instances monitored, but many more databases.

    2022-07-12 09_20_30-Global Dashboard — Mozilla Firefox

    If I were looking for the DatabaseWeekly database, I would need to know which instance this was hosted on. I do know, but someone in our IT support org might not.

    However, if they start typing in the search box at the, the instances shrink. This is the top left box that has “Filter by name” in light text. If I type “database”, you can see fewer instances.

    2022-07-12 09_22_07-Global Dashboard — Mozilla Firefox

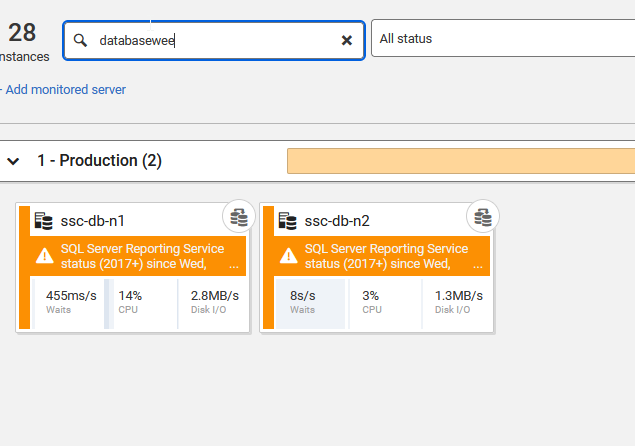
    If I add the weekly, then you see there is a cluster of two machines that have this database.

    2022-07-12 09_22_17-Global Dashboard — Mozilla Firefox

    If I pick one of these machines, I can see the databases with this name listed.

    2022-07-12 09_25_56-ssc-db-n1_(local) - Server Overview — Mozilla Firefox

    A handy little feature I knew nothing about.

    Give this a try if you have SQL Monitor and save even more time digging into performance issues. If you don’t have SQL Monitor, download an eval today and give it a try.

  • Alert Filtering in SQL Monitor

    SQL Monitor has improved a lot over the last couple of years. We have multiple teams building features and addressing issues, and each month when we have a readout of changes, I’m impressed. Since we update the produce every week or two, customers are seeing these enhancements regularly.

    Recently I saw a demonstration of the alert filtering improvements and I wanted to share a few thoughts.

    Lots of Alerts

    If I go to monitor.red-gate.com, there are a lot of alerts raised across our test systems. While each individual card shows the current alerts, there are more behind the scenes. I’ll write about the cards another time, but in this post, let’s just look at the Alerts tab.

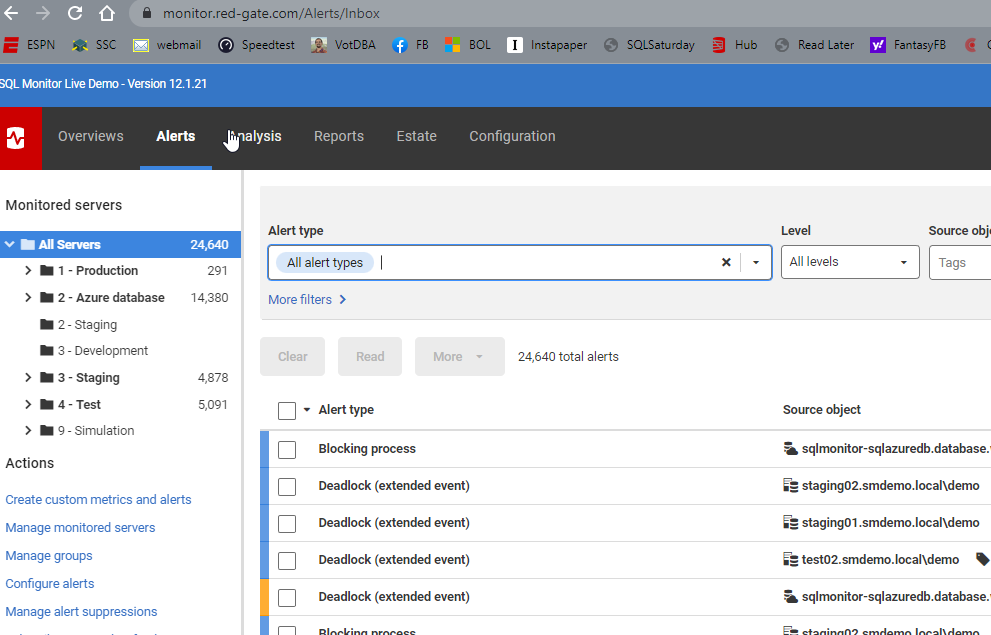
    You can see in the image there are 24k+ alerts, and they are distributed across a variety of systems. The left side shows the groupings for databases and a count of alerts.  The main section of the screen shows lots of alert types listed, the source database, etc.

    2022-06-21 11_23_21-Alert Inbox

    One thing I like is the use of color and visual cues. Above, most of these alerts are low level, and bordered on the left in blue. A mid level alert is shown here in yellow. This helps me to triage and decide what to do.

    Filtering

    While I can click on the server groups on the left and limit the views to a group (or a server), there are still a lot of alerts. The Production group shows 291 below.

    2022-06-21 11_26_49-Alert Inbox

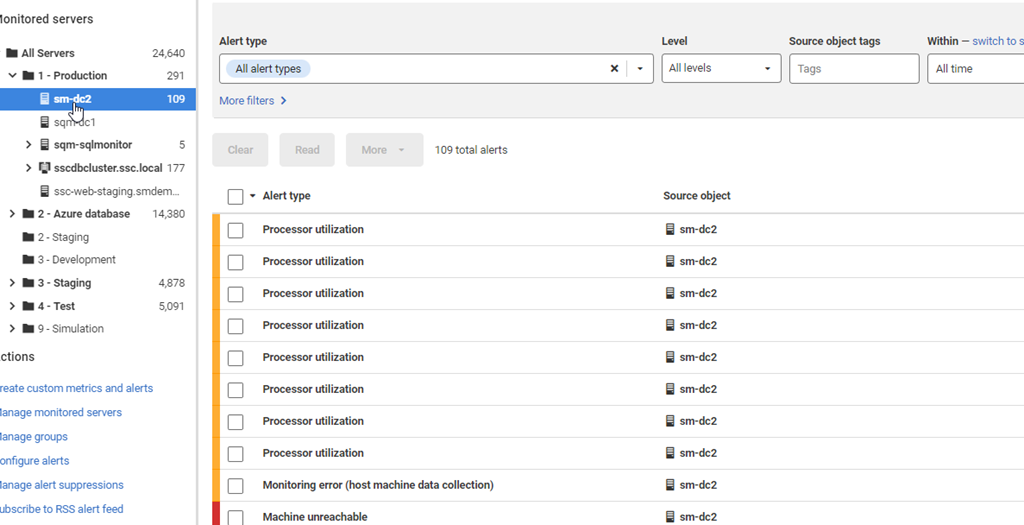
    The sm-dc2 shows 109 itself when selected.

    2022-06-21 11_26_56-Alert Inbox

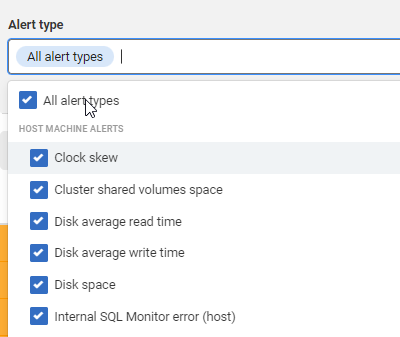
    One of the newer filtering options is that I can click the dropdown at the top of the screen for Alert Type and then limit what I see. The default is all alert types.

    2022-06-21 11_28_20-Alert Inbox

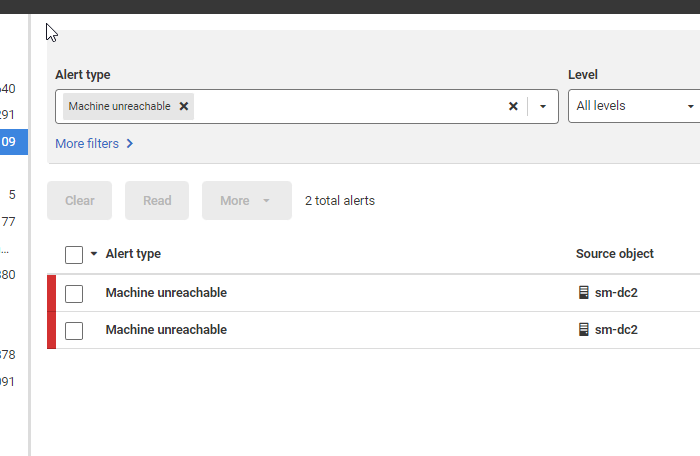
    However, I can uncheck that and pick just one type, like Machine Unreachable.

    2022-06-21 11_28_58-Alert Inbox

    Now I only see a couple of alerts.

    2022-06-21 11_29_44-Alert Inbox

    I can also filter by the alert level, tags, a timeframe, alert property, or alert status.  All of this let me focus in on specific aspects of what might be wrong with a database. Using Filters is a good way to more quickly determine what might be happening on a database and how frequently I have these issues. From there, I can use my own skills and understanding of the database to determine what might be causing alerts to fire.

    If you give SQL Monitor a try, I’m sure you’ll find it valuable for managing and monitoring your estate, helping you to quickly detect and respond to issues. Download an eval today and give it a try.

  • New Tagging in SQL Monitor to Keep Organized

    I recently got an update from the SQL Monitor PM on the progress we’ve made across all the teams. We have a number focusing on different aspects of the product, and they’ve built an impressive produce over the years. I remember when it was SQL Response and only provided alerting. Now it’s an Enterprise Monitoring solution for SQL Server.

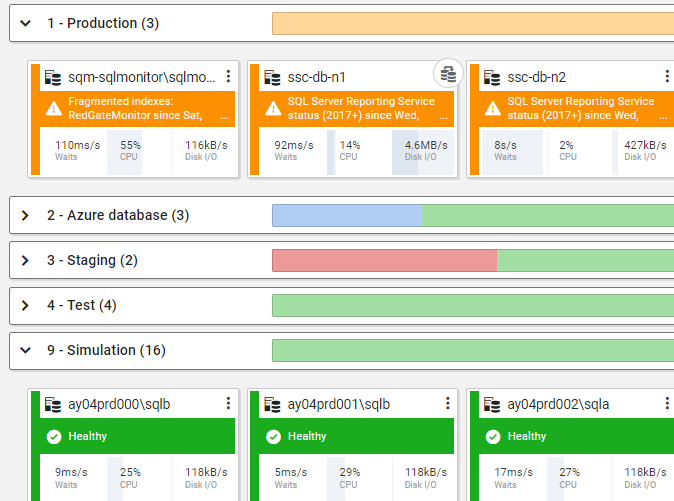
    One of the additions that was added across the last few months is tagging. Traditionally the monitored instances and databases are organized in categories, which is OK, but very limited. Below you can see at monitor.red-gate.com that we have instances in various categories: production, azure database, staging, test, and simulation.

    2022-02-10 12_12_40-Global Dashboard

    Tagging is a much more flexible structure that makes it easy to classify and filter your estate. There are plenty of cases where you might not only have an instance set as Production, but perhaps it’s a US or UK server and you want to know the geography. Maybe there is a need to know this instance also relates to CRM v a data warehouse system. Tagging makes that easy.

    Filtering with Tags

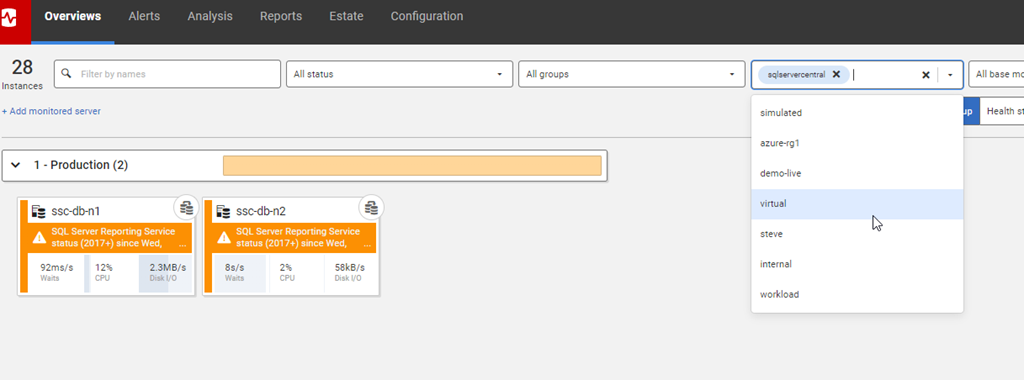
    At the top of the global dashboard shown above, there is a new filtering area where we can filter by tags. You can see below that I’ve filtered the 28 instances in our demo setup to the 2 that have the “sqlservercentral” tag.

    2022-02-10 12_15_45-Global Dashboard

    What’s more, clicking in the tag box shows me the existing tags that are applied.

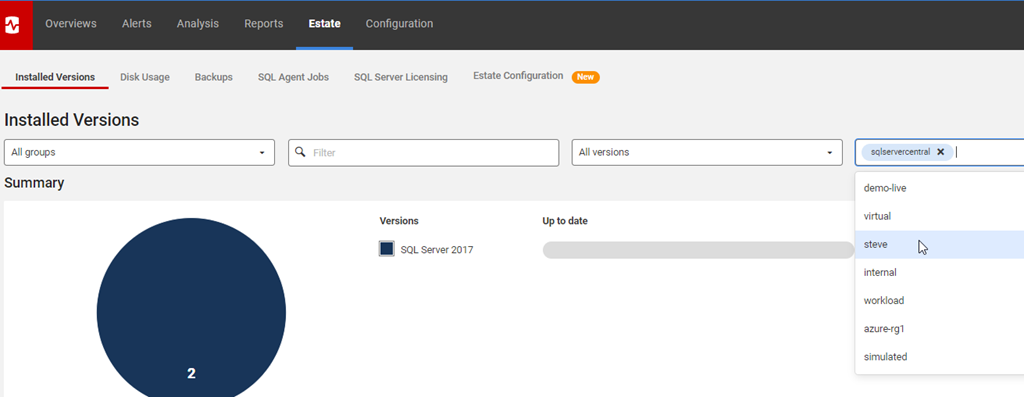
    Tagging is also available on the Estate tabs.

    2022-02-10 12_28_55-Installed Versions

    There are a few other places, and it’s slowly making its way across the product to all areas. You’ll see it slowly appear in other places as well.

    Adding Tags

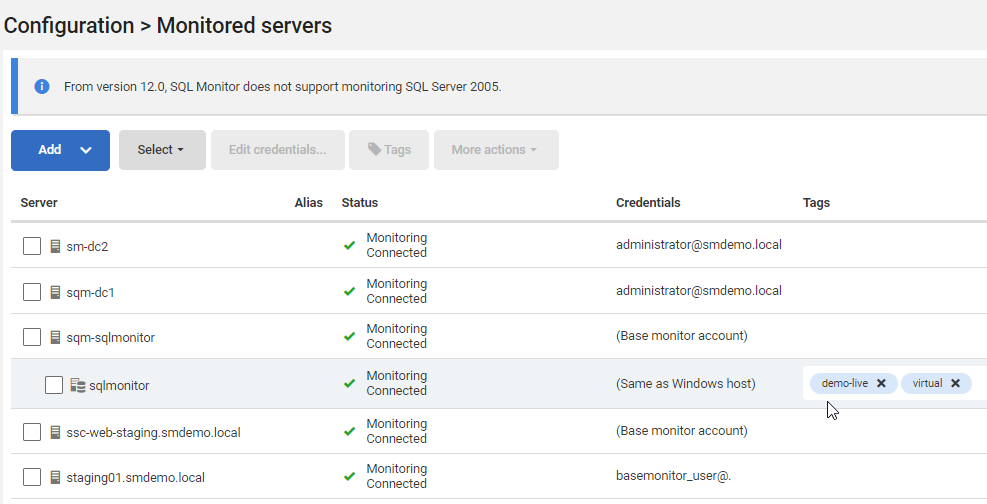
    You can add these in the Server Configuration, which works fine. Pick a server and then you can add tags that correspond to what you care about.

    2022-02-10 12_48_21-Monitored Servers

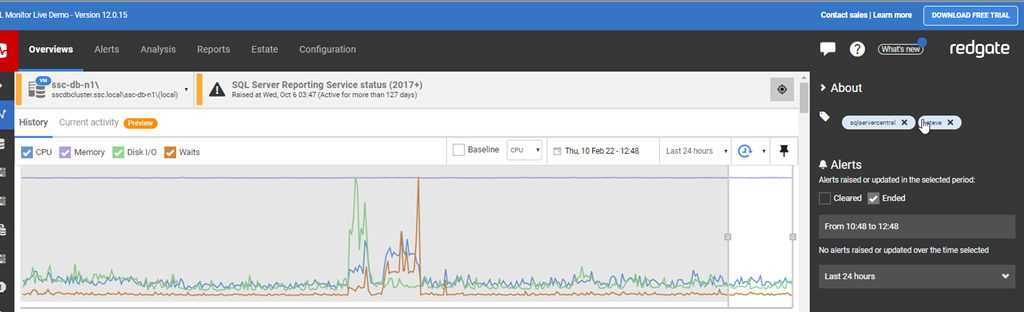
    If I’m working with a server in the overview, I can also expand the right Alerts panel and in the top About section, I can adjust tags. A good way to fix these up as you work on issues.

    2022-02-10 12_48_55-ssc-db-n1_ - Server Overview

    Look for tagging to make it’s way into the PowerShell cmdlets as well.

    There’s a post on the Redgate Blog about tagging as well. They are looking for feedback, so please send it along.

    If you haven’t used SQL Monitor, it’s a great tool to help you keep an eye on your estate with minimal effort. You can get alerted of issues and even integrate with other tools. Download an eval and give it a try today.;

  • Tagging in SQL Monitor

    For many of us, we’ve learned over time that we need to filter out the amount of things that we deal with in an given situation. We certainly often do this in queries with a WHERE clause.

    While plenty of software comes up with ways to group and filter items, often they are done in a way that doesn’t fit the needs to the user. An example of this is categories in SQL Monitor. They’re good, and people use them, but they aren’t enough. You can see the grouping/categories below from monitor.red-gate.com. The filter is at the top and the various cards are grouped under the three areas: Production, Azure database, and Staging.

    2021-12-02 10_40_13-Global Dashboard — Mozilla Firefox

    That is a gross filter, but often customers might have multiple ways they want to filter servers, so we’ve added something new: tags.

    In the demo system, there aren’t any set up yet, but you can see where these are added in the Monitored Servers configuration. You can create multiple tags for a database or select multiple databases and apply a tag to all of them.

    2021-12-02 10_37_38-Monitored Servers — Mozilla Firefox

    On the Overview page, you can then quickly filter down by tags at the top. Just to the right of the groups.

    2021-12-02 10_37_14-Global Dashboard — Mozilla Firefox

    Not a huge change, but it’s one that is requested a lot and it’s rolling out now to your SQL Monitor installs. Give it a try and as always, give us feedback on how it works.

    If you haven’t tried SQL Monitor, download a trial and see how easy this makes monitoring your SQL Server databases.