

I’m back from a great vacation. I had the chance to visit two new countries (for me and my wife) and many new cities as we cruised around the Adriatic. We also had a chance to see our daughter, who is in school in Leuven.
I’ve been tracking my travel for years, partially for fun, and partially with my boss so we can try not to overload me. I capture some data, which helps me understand where I’m going, as well as how far I am from home. I’ve written about this a few times, and showed the image below in my 2023 year in travel.
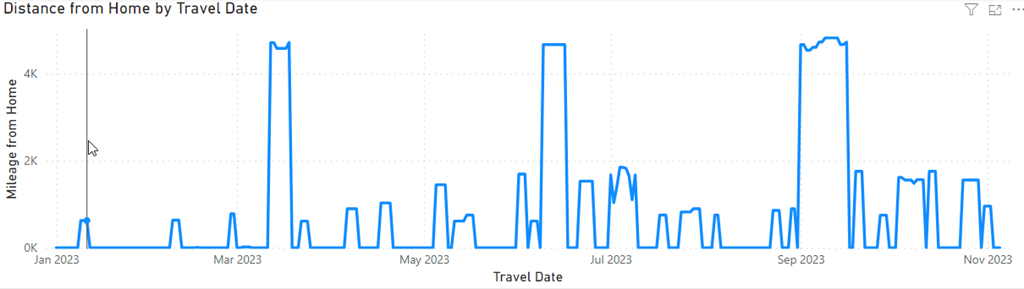
This lets me see a frequency of travel at a glance, as well as how far I am from home. That June above was a tough time with too many trips too close together, all of which were far.
I decided to have a little more fun, as I have a map in my Power BI report. I filtered travel by year, and then recorded myself clicking through the years. This spans 2014-2026, and as you can see, I have some very wild travel patterns across the years.
I bet you can also guess where 2020 falls in the animation.


Leave a Reply