Tag: Business Intelligence

  • Are Cubes Dead?

    I was talking with a friend recently about technology. This individual is a person focused on business intelligence, originally a developer, but now an architect and consultant. They have a fair number of clients and have worked with them to build solutions to assist in analysis and decision-making for all sorts of organizations. This person has primarily worked in the Microsoft stack but has embraced NoSQL, Hadoop, and other technologies. In many ways they view the world as I do, using what works well for a particular situation without prejudice. They want to be effective, using whatever technology may be best in the current situation.

    In their career, this person has extensive SQL Server Analysis Services experience and has built many cubes over the years that clients access with any number of front-end tools. I would guess that cube design and construction have made this person a lot of money over the years.

    As we talked, I wasn’t surprised to hear my friend say they thought cubes were dead. It was an approach to analysis that they wouldn’t recommend anymore. That is something I’ve felt for some time. As data volumes grow and competition increases, there is a need for more real-time analysis. The processing time for cubes doesn’t make sense.

    Hardware advances, query technologies against files in data lakes, and automatic ingestion of large volumes of data into columnar formats have reduced the need for data mart cubes. I see less and less content produced in this area, both by vendors and individuals working with technology. ETL has given way to ELT, and data lakes seem to be far more useful than data marts that pre-aggregate data in predefined ways.

    Most of you reading this work in the OLTP space, but there are plenty of you that built BI solutions or interact with those that need them. In the modern, 2020s era, do you find people still building new cubes and taking advantage of ROLAP/MOLAP/HOLAP systems? Or is this now legacy tech you can’t wait to remove from your infrastructure? I think BI is more important than ever, but cubes are dead.

    Steve Jones

    Listen to the podcast at Libsyn, Stitcher, Spotify, or iTunes.
  • Data Science, BI, and Reports

    Data science, along with the Artificial Intelligence (AI) and Machine Learning (ML) fields, is often seen as the new direction in which we ought to move our analysis of all the bits and bytes that we collect and store in our databases. There is so much hype now about those technologies, and managers are buying in.

    I’m not sure I agree. I do think that AI and ML will increasingly be used, but they’re just a part of what you use to analyze data. Buck Woody has a good post about the way in which we might examine our technology stacks used for BI work.

    We have a lot of reporting technologies to enable us to make better decisions, and there is a space for all of them. Many people like Excel, some use tools like Power BI and Tableau, still others prefer to get insight boiled down to a single number that influences them to move one way or the other.

    There is a lot being written about AI and ML technologies and certainly many organizations experimenting with them. Data Ccience covers these areas and more, asking our data not just what it says, but potentially what this might mean in the future.

    However, this doesn’t replace traditional BI and reporting. As Buck notes, these are tools and you should use the ones that work for your organization. Learn about them, experiment, understand the impact they have on your audience, and choose the best tools for the job.

    I’m sure this area will continue to evolve, and we’ll get new tools and techniques to help organizations make better decisions. Whether this will actually improve forecasting is likely up to the skills of both the technical and business people.

    Steve Jones

  • T-SQL Tuesday #75–Power BI

    This month’s host is Jorge Seggara, the @sqlchicken, who works for Microsoft. A busy schedule caused a slight delay, so we’re posting the third Tuesday of this month, but that is OK. This is a great topic for T-SQL Tuesday.

    Power BI Data

    While Power BI is a great visualization tool, you can’t do anything without data. That means you need to find data, which is both easy and hard. Easy if you’re working within your own organization on a specific project. Slightly more complex if you want to look at data out in the world.

    However I saw this in a talk last year and I was amazed. This is the type of thing I’ve written before, and it’s cumbersome and problematic. I would think that SSIS would have made things this simple years ago.

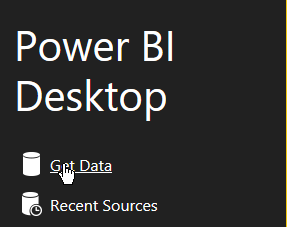
    I love sports, and wanted to play with some sports statistics awhile back. Finding good data is tough, at least in a format like CSV, that you can easily import. However Power BI makes this easy. Start up the desktop and you’ll see this:

    2016-02-10 14_07_40-Calendar

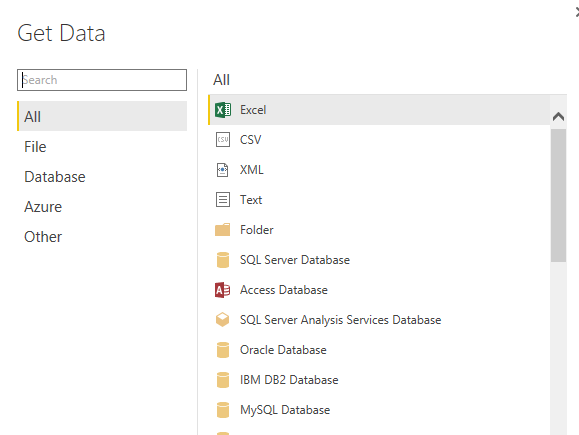
    Right away Power BI wants to get data. Click on this and the Get Data dialog opens, with lots of choices.

    2016-02-10 14_07_57-

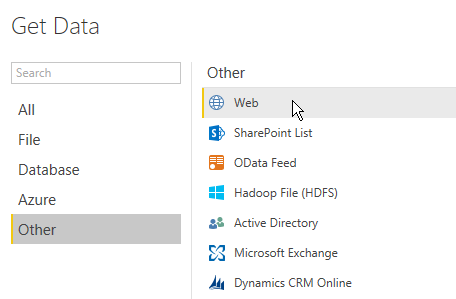
    However if you pick “Other”, you’ll see one more that I love. Web.

    2016-02-10 14_13_55-Calendar

    Click this. You get asked for a URL. Any URL.

    2016-02-10 14_14_35-Calendar

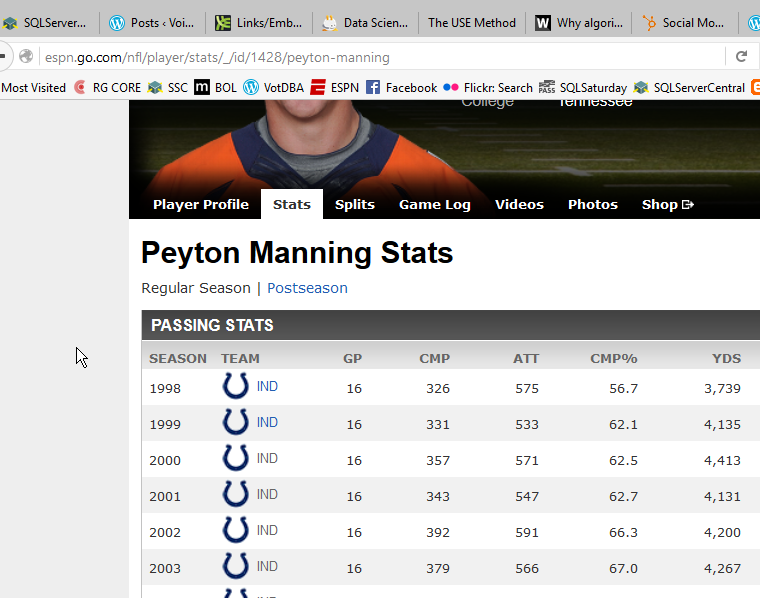
    I happen to have one handy. After the win for Denver in Super Bowl 50, I thought I’d look back at Mr. Manning’s career.

    2016-02-10 14_14_44-Calendar

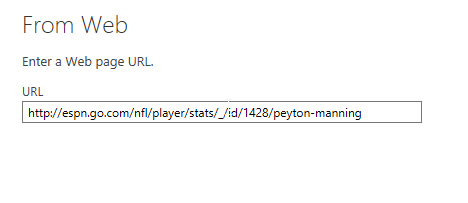
    I take that URL and drop it in the dialog.

    2016-02-10 14_14_52-Calendar

    Once I click OK, this will analyze the URL for tables of data. In this case, I get quite a few.

    2016-02-10 14_16_32-Calendar

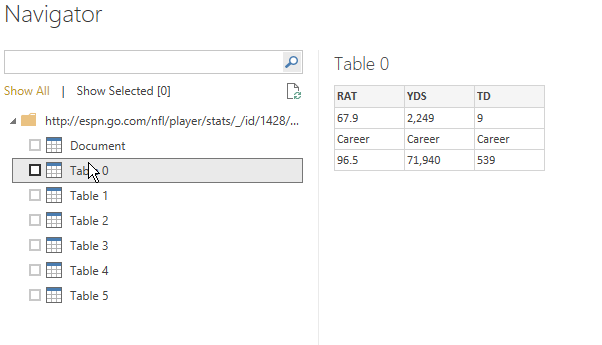
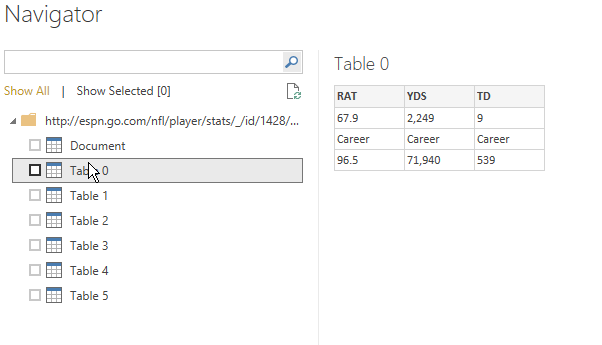
    Now, I can click each one to see what data this is. This isn’t what I want

    2016-02-10 14_16_32-Calendar

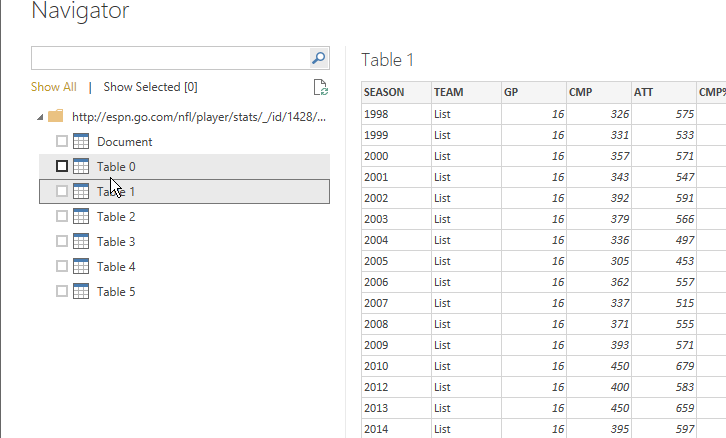
    But this is.

    2016-02-10 14_16_37-

    I now click “Edit” at the bottom to clean my data. I could just load it, but there are a few issues.

    2016-02-10 14_16_47-Untitled - Power BI Desktop

    I see all the data in the designer, and I have lots of options for working with this data.

    2016-02-10 14_17_11-Calendar

    First, since I’m going to do a comparison, let me rename the table.

    2016-02-10 14_17_02-Untitled - Power BI Desktop

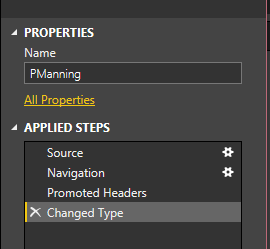
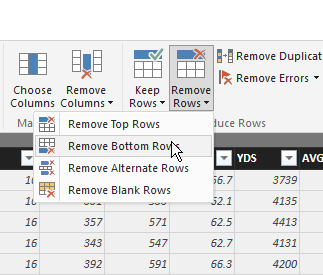
    Next, I see the steps below the name. I’ll add more steps, but I’ll do this in the designer GUI. First, let me remove the last row, which is a career summary.

    2016-02-10 14_19_28-Calendar

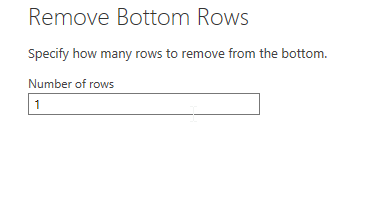
    In this case, I’m only removing one row.

    2016-02-10 14_19_36-Calendar

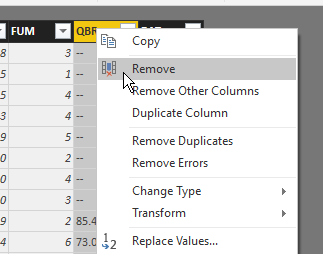
    Now, I want to remove a couple columns. In my case, I don’t care about a few of the data items, so I’ll pull them away. I can right click a column or choose “Remove Colums” in the ribbon. Either way, I get rid of QBR and Team.

    2016-02-10 14_20_50-Untitled - Query Editor

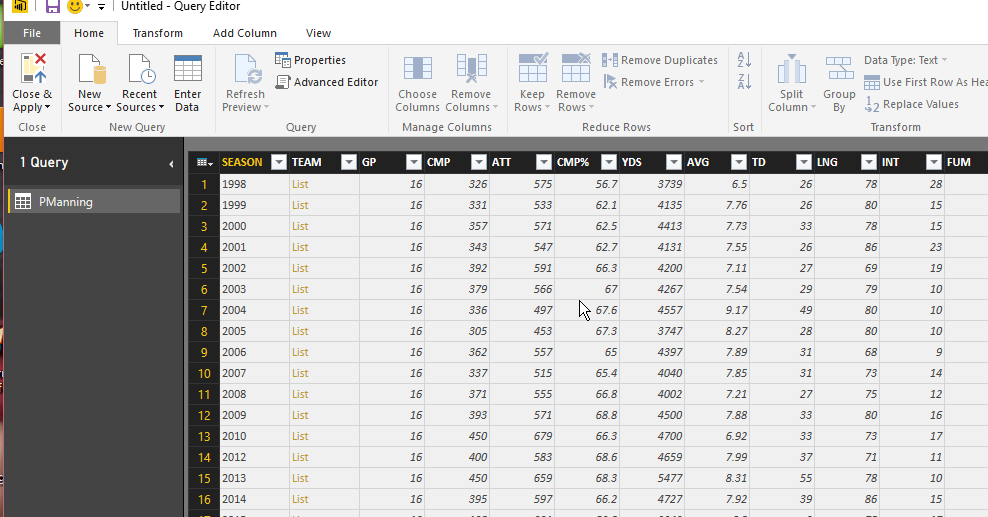
    Now I’ve got a nice year by year summary of Peyton Manning’s career. When I close and apply the query, my data is loaded into a data set for use by my Dashboard. I can then repeat this, and I’ll have two sets of data.

    And, here’s my PowerBI Dashboard. It’s not terribly useful, or interactive, but it’s got data from the web that I didn’t have to copy or move.

    https://app.powerbi.com/view?r=eyJrIjoiMWNmYzBiYjUtMTU3Yi00NWFhLWFiZjQtNTY0NzY4NDRkZTJmIiwidCI6IjY2NjBkOGZkLTJjNmItNDg0Mi1iZmZmLTcxOTY1YzE2NTczYSIsImMiOjN9

  • Data Darwinism

    A great look at the future, where data about you will decide much about your life.
    A great look at the future, where data about you will decide much about your life.

    A few years ago my son asked me to buy him The Unincorporated Man. After he finished it, he gave it to me and we read all four books in the series, which we both enjoyed. The premise of this future civilization is that each person is their own corporation, selling stock in themselves to anyone in the world. As with a company, the better your performance at life, the higher the price. However there is also accountability, with your actions, jobs, etc., potentially limited by your “board of directors”, who are the shareholders in your corporation. It sounds a little drastic, but it’s not as bad as you might think. It’s actually a neat idea.

    It’s also somewhat of the way the world works now, although without all the disclosure. In today’s world it’s actually much easier to hide your flaws and poor performance because the information isn’t always readily available to potential employers. Some of us see this in the poor performance of colleagues, who were hired with good recommendations or interviews. We may find out later that these were exaggerated, though we often can’t (or won’t) do anything about this, suffering through poor performance from the individual or company.

    That may be changing. I ran across an interesting article where vehicle drivers were let go from their jobs because clients had rated them poorly or complained about them. There is some controversy here, but it does bring up the issue of more companies that look to “go where the data goes” in operating their businesses. It’s all too easy to begin using metrics, measurements, feedback, and more to make business decisions. This is one of the driving forces being building business intelligence systems in our industry. However if the models, assumptions, or data are flawed, bad decisions are not only possible, but probable. It’s easy to trust the computer’s report more than is prudent, especially when we have no good way of measuring the quality, or even appropriate interpretation of the data.

    There are lots of BI systems that work well, and provide companies with many benefits, but there are probably also plenty of them that don’t work well and we don’t hear about them. There are systems that use flawed, incomplete, or otherwise compromised models to help business leaders make decisions. Ultimately a BI system needs lots of human intelligence added to it, including judgement and refinement, constant tweaking, and a bit of common sense. I would hope that using data to cut off some service, fire an employee (or decline to interview someone), or make any far reaching decision has a lot of experience and audit built into the system to prevent its abuse.

    Steve Jones


    The Voice of the DBA Podcasts

    We publish three versions of the podcast each day for you to enjoy.